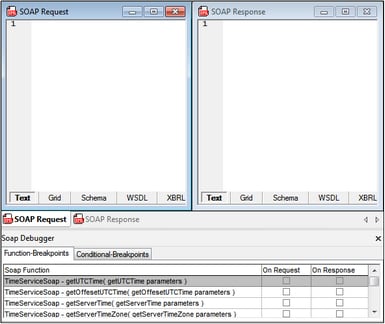
SOAP Debugger
The SOAP Debugger (screenshot below) can be used to view and analyze SOAP requests and responses. It works as a proxy server between your client and the web service. You can do the following:
•Step through SOAP requests and responses
•Modify SOAP requests and responses
•Forward modified requests to the client or server
•Allow breakpoints for every request and response message, including conditional breakpoints via XPath expressions
The SOAP Debugger works as follows:
•SOAP Debugger options should be set before you start a SOAP Debugger session. These options include the computer's IP Address, and layout and timeout options for the SOAP Debugger.
•To open the SOAP Debugger (start a session), select the toggle command SOAP | SOAP Debugger Session. At this point, you must (i) provide the location of the WSDL file that will be used to provide the relevant SOAP information, and (ii) information about the source and target ports.
•In the SOAP Debugger Breakpoints window, set the required breakpoints.
•Now you can open the file that makes the SOAP request and run the SOAP Debugger.
•You can then analyse the results, and, if there are any errors, fix them.
•To close the SOAP Debugger, select the toggle command SOAP | SOAP Debugger Session.
In the sub-sections of this section, we describe how to use the SOAP Debugger.
The file DebuggerClient.htm, which is located in the C:\Documents and Settings\<username>\My Documents\Altova\XMLSpy2024\Examples folder, is used as an example file. For this example file, the browser window acts as the client application which sends and receives SOAP messages. The Nanonull Time Service service is the web service server and is located at: http://www.nanonull.com/TimeService/TimeService.asmx?WSDL.
