Using the Values Window
The Values window displays information about the values processed by the mapping when in debug mode. The information displayed in the Values window depends on the current debugger position, and on the user interface elements that you clicked. The Values window contains the following tabs:
The "Context" tab
The Context tab displays the value currently being processed (the same value whose context is shown in the Context window). This is either the value at the current execution position of the debugger, or the value of a connector processed in the past. MapForce helps you distinguish between the two using colors:
 | Green is "the present"; it indicates the current execution position (see Viewing the Current Value of a Connector). |
 | Yellow is "the past"; it indicates that you are looking at some connector in the past, relative to the current execution position. This may happen after you set a context manually (see Setting the Context to a Value). |
The "Related" tab
The Related tab displays values that are related to (or represent the "near past" of) the currently processed value. Normally, you do need to explicitly click this tab; MapForce switches to it automatically when you click the data overlay of a connector that is related to the current execution position of the debugger. See Stepping back into Recent Past.
The "Sequence" tab
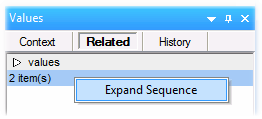
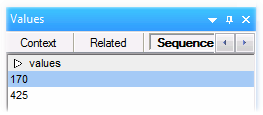
When present, the Sequence tab enables you to get access to the values of a connector that processes a sequence. This tab is visible only when a connector has processed a sequence of items (for example, an aggregate function such as sum or count does that). When you click the data overlay of a connector that processed a sequence of items, the Values window displays an entry in the format "n items", where n is the number of items processed by the connector. To get access to each value, double-click this entry (or right-click it, and select Expand Sequence from the context menu).

The values are then displayed in the Sequence tab.

The "History" tab
The History tab displays values have been processed by a particular node since debugging started and up to the current execution position. See Viewing the History of Values Processed by a Connector.