Stepping back into Recent Past
When you click a data overlay (small rectangular box) next to a mapping connector, the Values window displays the name and, optionally, the value associated with the selected connector. The focus now is no longer on the current debugger position, but on the selected data overlay. You can consider this view as stepping slightly back in the debugging history. This is the "near" past, since the mapping displays data overlays only for the last few connectors related to the current debugger position. When you click such a "related" data overlay, the Values window switches automatically to the Related tab.
For an illustration of this scenario, open the mapping PreserveFormatting.mfd from the <Documents>\Altova\MapForce2025\MapForceExamples\ directory.
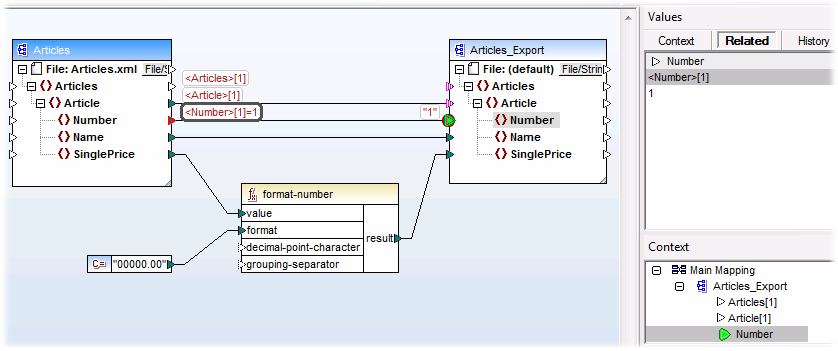
After opening the mapping, click the connector next to the Number node on the target component, and press F9 to add a breakpoint on it. Press F5 to start debugging, and then click the data overlay (small rectangular box) next to the Number node of the source component.

Because a connector is typically iterated multiple times for the lifetime of a mapping, the current index of the iteration is displayed enclosed with square brackets: <Number>[1]. Also, because the connector carries a value, its value is also represented after the equal sign: <Number>[1]=1. The same value is displayed on a new row in the Values window, as shown below.
If you need additional information about a particular value, remember that you can recreate the context that produced it (see Setting the Context to a Value ).