Table Display (JSON/YAML)
Table Display view
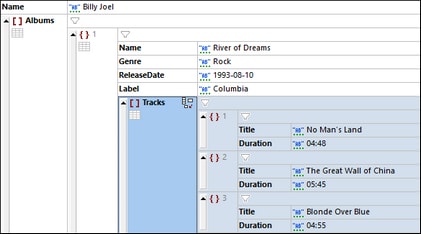
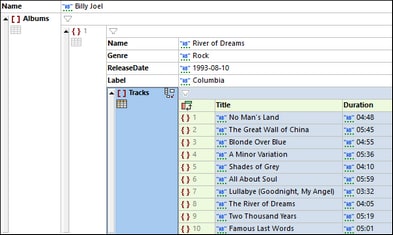
Objects and arrays that contain at least one object or array can be viewed either as a list (highlighted in screenshot at left) or as a table (highlighted in screenshot at right). To switch between these two views, click the table icon that is located below the object or array icon (see screenshot). In array tables, the array items are displayed as rows. For example, in the screenshot below right, the Tracks array is displayed as a table. This array consists of child objects, which are displayed as rows. Each object's properties (Title and Duration in the screenshots below) are shown as columns, with the names of common properties being displayed as the headers of columns. To switch rows and columns, click the icon in the top left cell of the table.
Icons for viewing and editing in Table Display
The icons shown below are available in Table Display and provide viewing and editing functionality.
| Optimizes widths of grid columns according to cell content. |
 / /  | When colored, Table Display is on, otherwise off. Click to switch the display |
A toggle command in top left cell of table. Switches rows to columns and vice versa | |
 / /  | When colored, a filter for the table, object, or array is active, otherwise the filter s deactivated. Click to deactivate/activate. To edit the expression, double-click it |
| Toggle command to word-wrap cells. When selected, word-wrap is on. By default. only the contents of items are wrapped. If you want to additionally wrap the names of items, choose this option from the icon's dropdown list. |
In an array: Append an array item to the list or table In an object: Append a key:value pair (as a row in a list, or (in table display) as a cell of a new table column) | |
Add an empty key:value pair; the type of the value is string by default | |
Select the datatype of a property value, or enter a comment or formula |
Editing in Table Display
In Table Display, you can carry out the editing actions listed below.
Add rows to a table
You can add rows in the following ways:
•Add a child row to the table: Select the table and, in the context menu, select the command Add Child (Ctrl+Shift+Enter). Alternatively, click the table's Append Child icon (see icon list above). A row will be appended to the bottom of the table.
•Append a sibling row to the table when a row is selected: Select a row and, in the context menu, select the command Append (Ctrl+Enter). A row will be appended to the bottom of the table.
•Insert a sibling row above the selected row: Select a row and, in the context menu, select the command Insert (Ctrl+Alt+Enter).
Enter or edit a property value
Select the table cell in which the property value is located and enter the value. The datatype will be automatically detected if the value is a string, number, Boolean, or null. In case of ambiguity, the type is set to string. You can override the automatic selection by using the datatype-selection icon (see icon list above). Alternatively, you can use an appropriate shortcut (see shortcut table below).
* | Auto (detects string, number, Boolean, null, and sets accordingly) |
" | String |
[ | Array |
{ | Object |
// | Comment (in JSONC, JSON5, YAML documents) |
= | Formula (in JSONC, JSON5, YAML documents) |
Add an empty row cell in a new column
You can add a new cell to a row. The new cell will be part of a newly created column. To add the new cell, select the row you want and, in the context menu, select the command Add Child (Ctrl+Shift+Enter). Alternatively, click the row's Append Row Cell icon (see icon list above). The row cell will be created in a new column. The type of the value in the cell is string by default. Enter the property's value in the cell and the property's name as the column header. The other cells in the newly created column will be empty.
Sort table rows on the values of a selected column
You can sort the rows of a table on the relative values of one of its child nodes (a column). For example, you can sort rows on the basis of the LastName column to give you the repeating elements of the table sorted alphabetically. To sort on a column, select the column header and then click the Grid View toolbar command Ascending Sort or Descending Sort. These commands are also available in the JSON menu.
Sort order in some languages, especially those with non-Latin alphabets, may benefit from enabling the beta Unicode UTF-8 support in the Language Region Settings dialog of Windows 10 (or later). Do this as follows: Go to your Windows Settings dialog and search for Language Settings. Under Related Settings, click Administrative language settings. In the Region dialog that appears, go to the Administrative tab, and, under Language for non-Unicode programs, click Change system locale. In the Region Settings dialog that appears (screenshot below), select the option Beta: Use Unicode UTF-8 for worldwide language support and click OK.
Table Display and external applications
You can take advantage of the table structure to exchange data between Table Display and a spreadsheet application (such as MS Excel). To move data from Table Display, do the following:
1.In Table Display, select the nodes you want to copy. Do this by clicking the cells themselves, column headers, row headers, or the entire table. If you click the entire table or column headers, then column headers are also copied; otherwise they are not. (In the screenshot below, rows 1 to 8 are selected, together with their column headers.)

2.Select the context menu command Copy | Copy as Tab-separated Text.
3.Paste the data directly into the spreadsheet program.

Data exchange works in both directions. You can also copy data from a spreadsheet to Table Display. Do this as follows:
| 1. | Select a range in the external application and copy it to the clipboard (with Ctrl+C). |
| 2. | Select a single cell in Table Display. |
| 3. | Paste the copied data with Ctrl+V. |
The data will be pasted into the table with a structure corresponding to the original structure and starting from the cell selected in Table View. The following points need to be noted:
•If the data is copied into a cell that allows new rows and/or columns to be created without invalidating currently existing data, then new rows and/or columns will be created.
•Rows are created as new objects, while columns are created as properties of the table's (row) objects.
•If the table structure cannot be validly modified, then the new data overwrites the original data of the selected cell as text.
For more complex data exchange tasks, use the unique import/export functions of XMLSpy.


