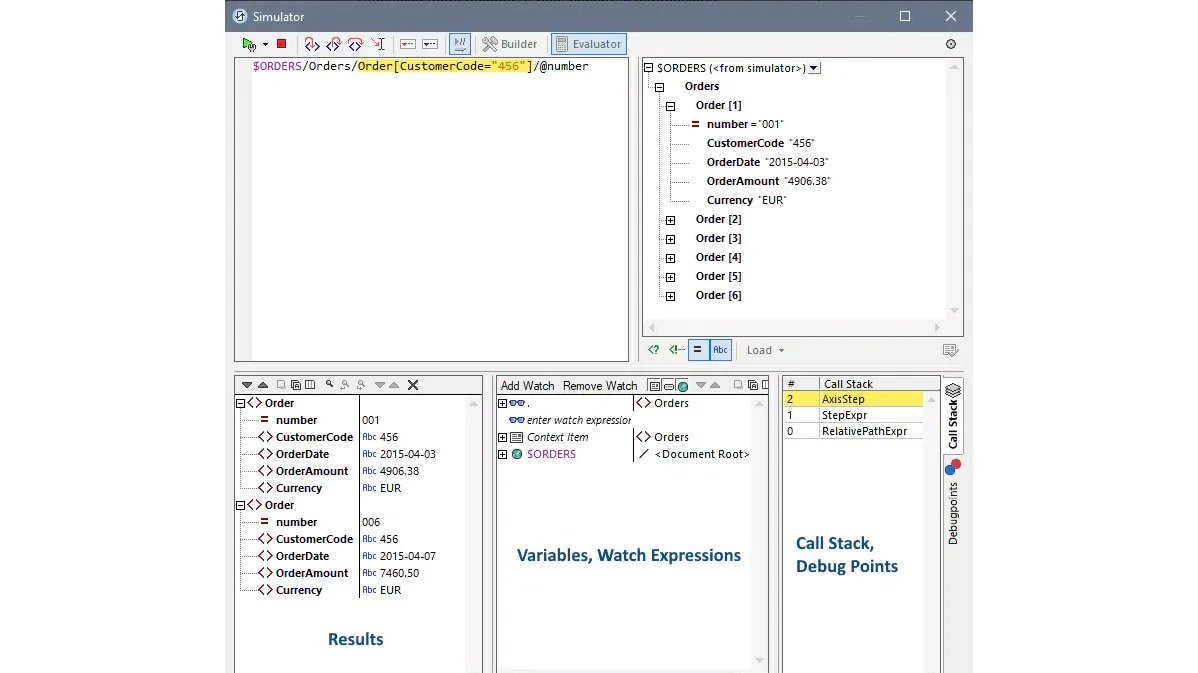
MobileTogether Designer includes an Actions and XPath Debugger that gives you the power to troubleshoot and debug your apps to immediately understand any app behavior - all directly in the design environment. This makes it possible to debug both the execution flow inside Action Trees AND the results of XPath/XQuery functions called inside those trees.
MobileTogether supports three debugging modes:
When a stop point is reached - either based on a defined breakpoint, an error, or at the next Action - the appropriate debugging view opens and you can step through the execution of the Action or XPath expression, viewing the callstack, how values of variables are updated, and results of watch expressions.
MobileTogether is the most affordable rapid app development framework that provides this level of debugging during development. The enterprise-grade debugger helps catch and resolve issues early, reducing the risk of bugs or performance problems in production. The ability to simulate different app environments and test thoroughly before release is crucial in enterprise and commercial settings, where failures can be costly and impact critical business operations.
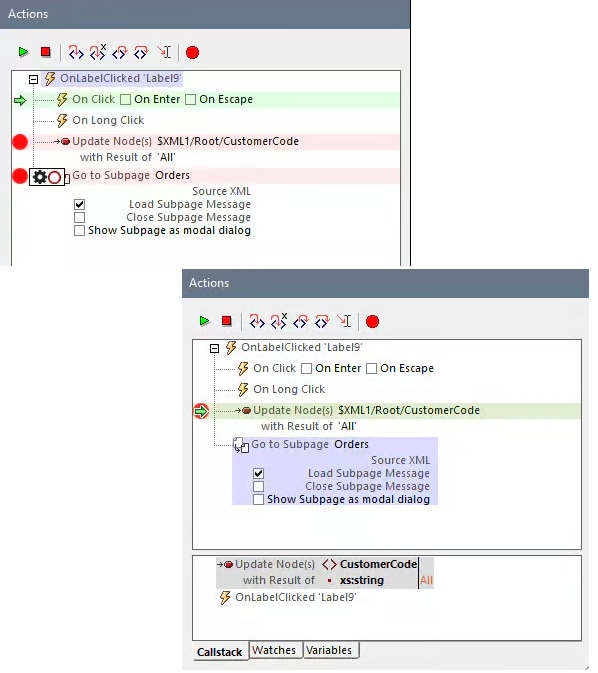
The Actions Debugger in MobileTogether allows you to examine and troubleshoot the actions of a control event or page event that are triggered by Action Tree. The Actions Debugger is critical for ensuring complex workflows perform as expected in a variety of real world conditions.
There are two ways to invoke the Actions Debugger during simulation: It can stop execution for debugging at a breakpoint previously set by the developer, or you can select an Action to debug directly during simulation.
The Actions Debugger displays the Action sequence in the upper pane. Below that you can examine the callstack of actions, view how the values of variables are updated during execution, and set watch expressions to test aspects of how an action is executed.
You can analyze the results of each Action step-by-step using the Step Into, Step Over, and Step Out buttons in the debugger toolbar. This allows you to observe the flow of execution and the changes to variables in real-time.
In addition to its visual Action Trees programming language, MobileTogether uses XPath and XQuery expressions to define how to process and manipulate data. Like all Altova tools that support XPath and XQuery, MobileTogether provides an integrated debugger to diagnose the results of expressions called inside Action Trees.
The XPath/XQuery Debugger is available when editing an expression in the MobileTogether XPath Builder, in the app simulator, and via the Actions Debugger. You can also set breakpoints on specific XPath/XQuery expressions to debug critical steps.
As with debugging actions, you can Step Into, Step Over, and Step Out. At each step, the debugger highlights the part of the expression currently being evaluated, and the corresponding result is displayed in a results pane. Additional panes show variables in scope, the call stack, and any watch expressions you’ve set up. Tracepoints can also be set to record evaluation results at specific steps, providing a traceable path through the evaluation of an expression.