About the Debug Mode
When you start debugging (by pressing F5, or F11, or Ctrl + F11), MapForce executes the mapping in debug mode.
While MapForce is in debug mode, the mapping is read-only. Although you can move components on the mapping area, most commands are not available. This includes commands such as mapping validation and deployment, code generation, documenting mappings, adding new components to the mapping area or reloading existing ones, and others. |
The debug mode enables you to analyze the context responsible for producing a particular value. This information is available directly on the mapping, as well as in the Values, Context, and Breakpoints windows. By default, these windows are displayed when you start debugging and are hidden when you stop debugging.
MapForce is in debug mode (and the mapping is read-only) until you stop debugging, by pressing Shift + F5 (or by clicking the Stop debugging ![]() toolbar button).
toolbar button).
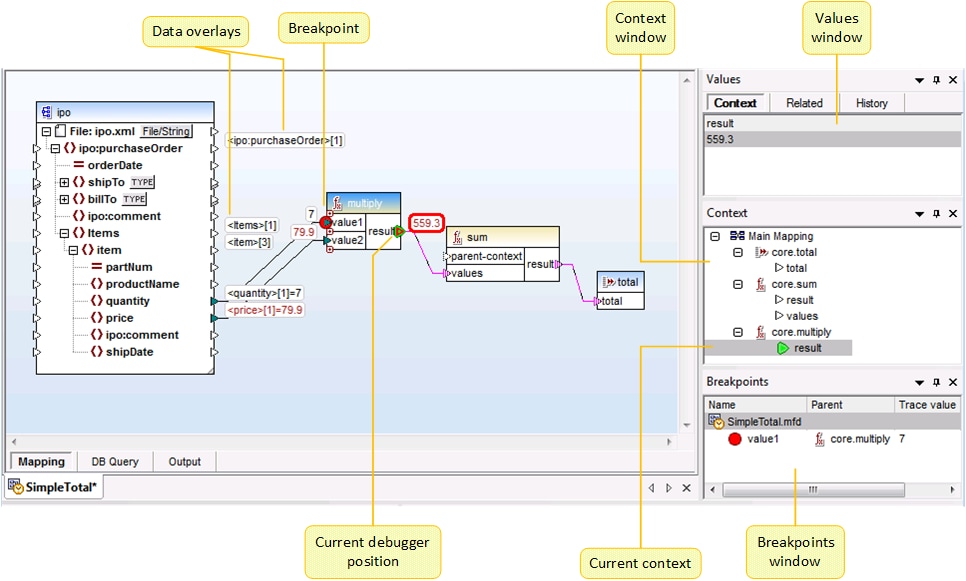
The following image illustrates a sample mapping (SimpleTotal.mfd, from the <Documents>\Altova\MapForce2025\MapForceExamples\ directory) that is debugged in steps (by pressing F11 to advance a step).

The MapForce development environment in debug mode
The visual clues and other information provided by MapForce while in debug mode are described below.
The mapping pane
While debugging, the mapping pane displays additional information:
•Data overlays (see below) show the current value and related values near their connectors.
•The current context (shown as a structure in the Context window) is highlighted as follows:
oConnectors in the context are striped magenta ( ![]() ).
).
oConnectors in ambiguous context are dotted magenta ( ![]() ).
).
oConnections in the context are striped magenta.
oConnections in ambiguous context are striped magenta but lighter.
•The current execution location is displayed with a green connector icon (  ).
).
Data overlays
The values processed by each connector are displayed as data overlays (small rectangles) near their corresponding connector. A currently selected data overlay is displayed with thick red border. Values changed from the last step are displayed in dark red. For nodes with simple content, the data overlay combines two values - the node name and the value. If the node name has been iterated multiple times before the current execution position, the index of the current iteration is indicated by the number in square brackets.
Data overlays have the following behavior:
•Pointing the mouse to a data overlay brings it temporarily to the foreground, clicking it does it permanently. Clicking also selects the corresponding connector.
•Data overlays can be moved by dragging.
•Data overlays move when a component is moved. Therefore, if the data overlays appear stacked because the components are too close to each other, drag the components around the mapping area to make more space, and the data overlays will move together with the component.
•Clicking a data overlay shows its value in the Values window.
•Clicking a connector also selects its data overlay.
Breakpoints
Breakpoints are designated milestones at which the mapping should break during execution in debug mode. This term may be already familiar to you by analogy with other integrated development environments. Unlike other development environments where you add breakpoints to a line of code, a breakpoint in MapForce can be added to an input or output connector (small triangle to the left or right of the connection). On the mapping pane, breakpoints are represented as red circles. Any defined breakpoints are also displayed in the Breakpoints window. See also Adding and Removing Breakpoints.
Current debugger position
The green triangle (  ) indicates the position of the debugger. This position is either an input or an output connector of any given component.
The value currently being processed is also displayed in the Values window, on the Context tab.
The set of connections and/or connectors colored in striped magenta indicate the current mapping context. The same information is also displayed as a hierarchical structure in the Context window (see Using the Context Window ).
When you set manually the context of a value, the current debugger position is in a position in the past relative to the most current execution position. To help you distinguish between the most current execution position and the one in the past, the "current position" connector may appear with the following colors in the debugger interface.
 | Green is "the present"; it indicates the current execution position (see Viewing the Current Value of a Connector). |
 | Yellow is "the past"; it indicates that you are looking at some connector in the past, relative to the current execution position. This may happen after you set a context manually (see Setting the Context to a Value). |
Values window
The Values window provides information about the values processed by the mapping. It enables you to see what the mapping processes at the current execution position, or in a particular context that you can set yourself. See also Using the Values Window.
Context window
The Context window provides a hierarchical view of the set of nodes and functions that are relevant for the current debugger position. See also Using the Context Window.
Breakpoints window
The Breakpoints window displays the list of debugging breakpoints created since MapForce was started. If you have defined breakpoints on multiple mappings, all of them appear in the Breakpoints window. See also Using the Breakpoints Window.