Viewing the Current Value of a Connector
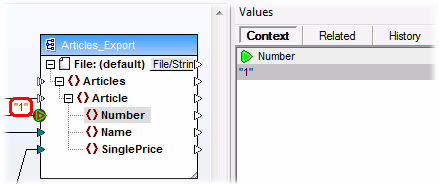
When the current execution position of the debugger (  ) is on a particular connector (either because you are debugging in steps, or because there is a breakpoint defined on the connector), the current value processed by the connector is displayed in the Context tab of the Values window. This is the value that is about to be written to the output, that is, "the present". It is also the value whose context is displayed in the Context window (see Using the Context Window ).
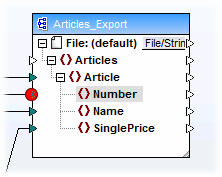
To understand this case, open the PreserveFormatting.mfd sample from the <Documents>\Altova\MapForce2024\MapForceExamples\ directory. Click the input connector of the Number node on the target component, and press F9 to add a breakpoint on it.

Then press F5 to start debugging and observe the results.

As shown in the image, the current debugger position  (and the breakpoint
  ) is on the Number node of the target component. The Values window indicates that this node processes the value "1" (this value is also highlighted with a thick red border on the mapping).