Chained Data Transformation
Complex ETL and data integration projects rarely fit into a single transformation. Developers often build multi-stage data pipelines where the output of one step becomes the input for the next. This approach makes it easier to manage dependencies, reuse logic, and keep large workflows maintainable. Breaking transformations into smaller, staged mappings also simplifies testing, debugging, and long-term scalability.
Altova MapForce supports this approach through chained data mapping, allowing you to connect multiple transformations into a structured processing workflow. This article explains when to use chained transformations, the problems they solve in real-world data pipelines, and how to build a modular, multi-stage workflow in MapForce.

Automatically Convert EDI to XML
EDI remains a foundational technology for B2B data exchange, even as modern integration architectures continue to evolve. For decades, EDI standards such as X12 and EDIFACT have enabled reliable, structured communication between trading partners across industries including retail, healthcare, logistics, and finance. Their longevity is a testament to their stability, scalability, and widespread adoption — especially in high-volume, mission-critical transactions.
At the same time, today’s enterprise systems increasingly rely on XML, JSON, databases, APIs, and cloud-based services. While EDI is great for standardized data exchange, its compact, positional formats are not designed for human readability or direct consumption by modern applications. As a result, EDI data must be translated and transformed to integrate smoothly with contemporary business systems and workflows.
Altova MapForce addresses this challenge with a powerful, graphical approach to transforming EDI to other prevalent data formats. It even includes automatic EDI to XML conversion.

Easy Tools for YAML Editing
With YAML becoming increasingly common in configuration files and data exchange, it makes sense for developers to seek out specialized YAML editors to add to their everyday toolkit.
Although YAML is simple, its strict reliance on indentation and formatting can make it prone to errors. Intelligent YAML tools provide features that can make coding faster while minimizing these issues. XMLSpy includes an easy-to-use text-based YAML editor as well as a unique YAML Grid view. YAML Grid represents the document structure in a visual way that makes it easier to understand—while unlocking additional functionality for efficient editing.

Build an MQTT-enabled App
As IoT adoption accelerates, developers are increasingly tasked with connecting large numbers of distributed devices across unreliable or bandwidth-constrained networks. In these environments, the choice of communication protocol is critical. MQTT has become a widely adopted standard for IoT and event-driven systems because of its lightweight footprint, low latency, and efficient publish/subscribe messaging model.
MQTT is flexible enough to support everything from small proof-of-concept automation projects to large, production-scale deployments. It enables real-time data exchange between devices while minimizing network overhead, making it well suited for scenarios such as sensor networks, industrial automation, and remote monitoring.
Altova MobileTogether includes native support for building MQTT-enabled apps for iOS, Android, and Windows. Its low-code, rapid mobile app development (RMAD) approach allows developers to integrate MQTT messaging into cross-platform applications quickly, while still retaining control over app logic and data handling.
Let’s see how it works.

Data Mapping Made Easy
With its visual, drag-and-drop approach, MapForce has always been designed to make data mapping and integration straightforward. In the latest release, two new features make the first steps even easier for users who don’t work with data integration or ETL tools every day. Today’s data analysts, Excel power users, and tech-savvy business users often need to map and convert data as part of their regular workflow, and now they can harness the power of MapForce to get it done.
A new guide bar walks beginners through setting up a mapping project, and a visual component gallery provides a clear, organized way to find and insert the components needed for different data formats and processing tasks.
Together, these additions help new users get oriented quickly and start building their first data mapping project.

How to View and Edit BSON
As applications scale, developers need data serialization formats that are compact, fast to parse, and easy to use across modern database systems. One format that continues to gain adoption is BSON (binary JSON).
While BSON is efficient and built for performance, editing raw BSON data directly is not practical because it is a binary format and virtually unreadable by humans. That’s where a professional BSON editor becomes important, offering a human-readable, hierarchical view for easy inspection, editing, and troubleshooting of the data.
To meet this need, XMLSpy now includes a full-featured BSON editor for editing and converting BSON documents in the same familiar environment developers use for working with XML, JSON, and YAML.

Using Decision Tables to Simplify Data Mapping Logic
A key aspect of any data mapping project is defining data processing rules for transforming data from its source to the target data structure. However, when those rules involve multiple conditions and exceptions, the logic can quickly become tangled and hard to maintain.
If your data mappings are held together by a web of conditionals, you’re not alone. Decision tables simplify that complexity, letting you define business rules in a clean, tabular format that’s easy to read, test, and maintain. For ETL and data integration teams, they deliver maintainability and consistency, especially when implemented directly in MapForce.

Unlocking Scanned PDFs with OCR Support in MapForce
For many organizations, PDFs are both a vital data source and a persistent roadblock in ETL and data integration workflows. While modern PDFs with selectable text are relatively straightforward to process, a substantial portion of business-critical data remains trapped in scanned documents—digitized paper archives, legacy records, and image-based files where text exists only as pixels, not as machine-readable characters. The challenge lies in transforming their unstructured content into usable data.
OCR (optical character recognition) support in the MapForce PDF Extractor addresses this gap, transforming content in image-based PDFs into structured, extractable data ready for processing and mapping to other formats.

New in Altova Software 2026
From BSON to XBRL with OCR in between, Version 2026 of Altova adds important new support for several industry standards and technologies. For customers of Altova desktop developer tools, server software, and regulatory solutions, this release includes a mix of new tools and functionality alongside updated support for new database and standards versions across the product line.
Let’s take a look at the highlights.
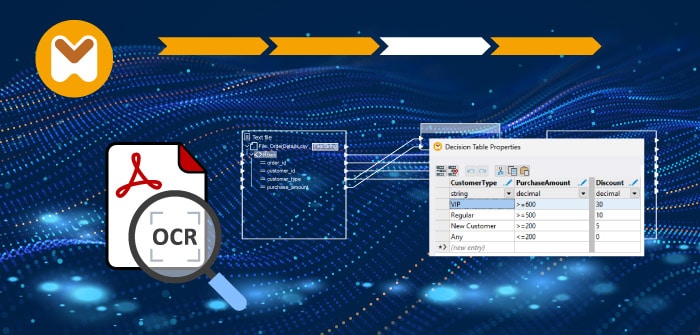
US-GAAP XBRL Reporting: Requirements, Challenges, and Solutions
In the United States, companies that file reports with the Securities and Exchange Commission (SEC) must prepare their financial statements according to Generally Accepted Accounting Principles, or US GAAP. These rules provide the foundation for consistent, transparent, and comparable financial reporting across public companies.
Over the past decade, the SEC has added another layer to this requirement: not only must financial reports be published in human-readable formats like PDF or HTML, they must also be filed using XBRL. And while standardizing data in this way offers numerous benefits, tagging financial data for XBRL can be a challenge for accountants and analysts who are experts in accounting data – not markup languages.
Faced with these challenges, companies often turn to specialized tools to streamline US-GAAP XBRL tagging. One such solution is xbrl-tagging.com, which provides an easy, visual way for organizations to manage the complexities of structured reporting – and it’s free.

ESEF Tools
The ESEF acronym has been top of mind for finance professionals across the EU and UK since mid 2019, when the reporting mandate from the European Securities and Markets Authority (ESMA) was announced.
ESEF, which stands for European Single Electronic Format, is a digital financial reporting standard based on XBRL. Since early 2020, companies on EU regulated markets have been mandated to prepare their annual reports in accordance with ESEF rules.
What exactly is ESEF compliance, and what does it take to meet reporting requirements? Let’s take a look at the basics and some tools that make it easy.

An Easy Solution for XBRL Tagging (and it’s Free!)
Over the last decade, the eXtensible Business Reporting Language (XBRL) has evolved from a specialized reporting format into the cornerstone of financial disclosure, with mandates now in place from the SEC, ESMA, and numerous other authorities worldwide. While this shift delivers greater standardization, transparency, and comparability of financial data, it also introduces significant challenges for filers.
Organizations must navigate large, complex taxonomies, adapt to varying jurisdictional requirements, and keep pace with frequent updates—all while ensuring accuracy in data drawn from both structured tables and narrative disclosures that are prepared for human audiences.
Traditional, code-intensive approaches often slow down reporting teams and increase reliance on external consultants. That’s why Altova developed a purely visual approach to generating XBRL reports.
Introducing the Altova XBRL Tagging solution – a free, cloud-based tool for tagging existing reports for XBRL without being exposed to the complexities of the underlying syntax.

AI Tools for Instant App Creation
Visual, no code tools like Altova RecordsManager have revolutionized the field of data-centric app creation, making it faster and more accessible. But now imagine expressing your database vision in a single sentence, and having it created automatically – including not just the database structure and tables, but forms and reports as well. That’s exactly what the new AI Assistant in RecordsManager does.
With a single AI prompt, users of all skill levels can turn their ideas into functional database solutions without any coding or database design expertise required. RecordsManager lets you skip the manual work of database design so you can focus more on the higher-level aspects of your project.
Let’s see how it works.

Manage Your Contracts in the Cloud
In today’s paperless world, organizations of all sizes still face the challenge of storing and managing contracts efficiently. Locked file cabinets have given way to digital storage, but shared folders often become disorganized and lack the access controls and security businesses need.
Many companies turn to contract management solutions. We did too. But after exploring the options, we found that none offered the right balance of simplicity, security, and flexibility for our needs. So we built our own.
Altova ContractManager is a secure, cloud-based contract management app that’s feature rich, highly-customizable, and affordable for firms of any size. Here's how it checks all the boxes.

Country by Country Reporting Made Easy
The Organisation for Economic Co-operation and Development (OECD) mandates that large, multi-national companies file annual Country-by-Country (CbC) Reports with local tax authorities. These reports must be submitted in a specific XML format that conforms to the OECD's official schema, ensuring consistency and comparability across jurisdictions.
Though this mandate has been in place for almost a decade, producing compliant CbC XML reports remains a technical challenge for corporate tax departments that rely heavily on Excel or traditional accounting systems. As deadlines approach each year, organizations face renewed pressure to convert financial data into properly structured XML, often without the in-house tools or expertise to do so efficiently.
To address this gap, Altova offers an easy-to-use, cloud-based solution that automatically generates a valid, properly formatted CbC XML report based on existing data. Users can enter data manually or via an Excel template, and the Altova CbC Reporting App does the rest. Let’s take a look at how it works.

How to Create Batch Data Mapping Projects
In the fast-paced world of modern application development, APIs are the glue that connects systems, services, and devices. REST APIs, in particular, are widely used for their simplicity, scalability, and flexibility. But as APIs grow in complexity and scale, managing them effectively becomes a challenge. That’s where the OpenAPI Specification (OAS) comes in.
OpenAPI offers a standardized way to describe RESTful APIs in a machine- and human-readable format. This not only enhances collaboration among development teams but also streamlines the entire API lifecycle, from design to documentation, integration, and testing. And with powerful tools like Altova XMLSpy and Altova MapForce, working with OpenAPI becomes faster, more visual, and far more efficient.

OpenAPI Tools for Developers
In the fast-paced world of modern application development, APIs are the glue that connects systems, services, and devices. REST APIs, in particular, are widely used for their simplicity, scalability, and flexibility. But as APIs grow in complexity and scale, managing them effectively becomes a challenge. That’s where the OpenAPI Specification (OAS) comes in.
OpenAPI offers a standardized way to describe RESTful APIs in a machine- and human-readable format. This not only enhances collaboration among development teams but also streamlines the entire API lifecycle, from design to documentation, integration, and testing. And with powerful tools like Altova XMLSpy and Altova MapForce, working with OpenAPI becomes faster, more visual, and far more efficient.

Updating Shopify Inventory From a Mobile App
One of the benefits of using Shopify as an ecommerce platform is that it provides robust inventory management features. However, maintaining accurate inventory records in real-time can be challenging, especially for merchants who rely on manual data entry during inventory audits or restocking.
Handheld barcode scanners are a great solution for increasing speed and accuracy during inventory checks, but storeowners often lack a seamless way to connect scanner data directly to the Shopify system. Without proper integration, staff may still need to manually transfer scanned data into Shopify, negating some of the efficiency gains that barcode scanners are meant to provide.
Let’s take a look at a real-world scenario for building a mobile app with barcode scanning functionality that integrates directly with Shopify for real-time inventory management.

Exporting Products from Shopify as CSV
Shopify is a massively popular ecommerce platform in wide use by retail businesses large and small. Though Shopify provides easy-to-use tools for setting up and running an online storefront, managing the vast amount of data behind the scenes, such as product catalogs, customer information, order records, and inventory, can quickly become complex.
Businesses often need to integrate Shopify data with backend databases, ERP systems, CRMs, data warehouses, or other platforms to streamline operations, perform deeper analytics, or support automation workflows.
This is where a data mapping tool with Shopify support becomes essential, allowing businesses to transform, map, and move data between Shopify and other systems efficiently and accurately.
Let’s look at an example of a common scenario – extracting product data from Shopify to a CSV file – using visual tools in MapForce.

New Tools for Shopify, OpenAPI, and More
With Version 2025 Release 2, we’ve expanded functionality for working with YAML, OpenAPI, and XBRL, while also introducing new support for Shopify data integration.
Our ongoing commitment to integrating and enhancing support for popular technologies means developers have the functionality they need to stay in step with evolving industry standards—using tools they already know and trust.
Let’s take a look at the highlights in this release.

What is ETL?
ETL—extract, transform, load—is the backbone of modern data integration. While most technical professionals understand the basics, the real challenge lies in designing efficient, scalable ETL processes that handle complex data transformations while maintaining performance and accuracy.
In our latest video series, we break down how ETL works, common challenges with defining ETL workflows, and how graphical tools like Altova MapForce can help. We’ll walk through demos of real-world scenarios such as transforming and loading CSV reports to a SQL database, as well as implementing scalable automation.
Whether you’re optimizing an existing process or researching new ETL tools, this series covers all the bases.
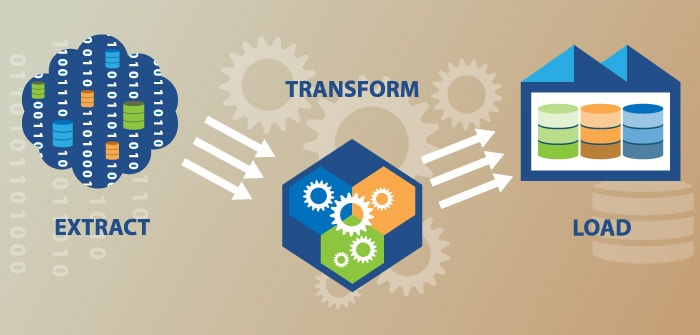
ETL Tutorial: Video
ETL processes span a wide spectrum of complexity, from straightforward tasks like a one-to-one mapping of an API payload to a database, to highly intricate scenarios requiring extensive data filtering, transformation, and manipulation.
Altova MapForce can tackle this full range of ETL tasks. Check out the video to learn more.
ETL Basics: CSV to Database in MapForce
ETL processes are increasingly required in modern enterprises as organizations receive data in diverse formats that must be transformed and loaded into target databases or business systems. ETL projects range from simple to highly complex, depending on the specific requirements.
A common example of a straightforward ETL process involves extracting CSV data from incoming files, mapping the data structure, applying basic transformations to align with the target schema, deduping records, and then finally loading the processed data into a SQL database.
Whether an ETL project is basic with just a one-to-one mapping or more complex with sophisticated data processing requirements, developers need tools that can handle the scope of complexity without a huge learning curve – or price tag. That’s where MapForce comes in.
Learn About XULE for XBRL
XBRL (eXtensible Business Reporting Language) is an open, XML-based standard for the electronic submission of business and financial data. Though XBRL specifies what data must be reported and provides a standardized way of doing so, companies and regulatory agencies need a way to ensure the quality of data that is submitted. One approach is by using business rule validation, and XULE is one method that is growing in popularity in 2025.

How to Run Altova Server Software in Docker
Docker has revolutionized how developers build, ship, and run applications by offering a lightweight, portable solution for containerizing software. Containers package applications with all their dependencies, ensuring they run consistently across different environments, whether on a developer’s machine, a test server, or in the cloud. Compared to traditional virtual machines, Docker containers are faster to start, consume fewer resources, and make scaling applications easier. This efficiency has made Docker a go-to tool for software development and deployment.
Running Altova Server Software in Docker brings these benefits to enterprise-level data processing and automation tasks. By containerizing tools like FlowForce Server, MapForce Server, or RaptorXML Server, developers get a highly portable, scalable, and efficient solution for managing complex workflows as well as automating data transformations, validation, and report generation.
To make getting started even easier, Altova offers an open-source project for automating the set-up process in a Docker environment.

Text Search for Precise PDF Data Extraction
PDF documents are used at many stages of modern business workflows, often serving as the format of choice for invoices, reports, legal contracts, and other critical documents. While PDFs are ideal for preserving content integrity and a particular visual layout, their structure makes automated data extraction challenging. For organizations engaged in data integration and ETL, unlocking information contained in PDFs is a necessity—and this is where the MapForce PDF Extractor comes in.
The MapForce PDF Extractor includes multiple tools for visually defining extraction rules to map PDF data to other formats. One that is particularly useful for zeroing in on specific content is text search. Here’s how it works – including a video demo.

How to Implement EBA XBRL Data Quality Checks
The European Banking Authority (EBA) requires banks to use the XBRL data format for their filings. XBRL is a standardized format that makes it easier to collect, analyze, and compare data from different financial institutions. By adhering to the EBA XBRL taxonomy, banks submit data that is consistent and easy to validate, which simplifies the reporting process for both filing institutions and regulators. This streamlined approach improves reporting accuracy and helps the EBA maintain better oversight of the European banking sector.
In addition to required validations in the EBA XBRL Taxonomy, the EBA recommends a set of optional data quality checks that allow reporting organizations to further improve data accuracy and compliance with regulatory requirements. These extra validations help filing companies improve the accuracy and integrity of their reported data – but only if the checks are supported by their XBRL reporting tools.
As part of its comprehensive XBRL support, Altova can run the optional EBA XBRL data quality checks in multiple products. Let’s see how it works.

Easy Tools for YAML Editing
With YAML becoming increasingly common in configuration files and data exchange, it makes sense for developers to seek out specialized YAML editors to add to their everyday toolkit.
Although YAML is simple, its strict reliance on indentation and formatting can make it prone to errors. Intelligent YAML editors provide features that can make coding faster while minimizing these issues. XMLSpy includes an intelligent, text-based YAML editor as well as a unique YAML Grid view. YAML Grid represents the document structure in a visual way that makes it easier to understand—while unlocking additional functionality for efficient editing.
Let’s take a look at how it works.

Altova Version 2025 with YAML Grid and More
The latest version of the Altova product line introduces a host of new features and functionality. Customers now have access to new, visual YAML editing tools, improved options for extracting PDF data for mapping to other formats, updated SQL and NoSQL data integration support, and more.
Whether working with Altova developer tools, server software products, or XBRL add-ins for Excel, this release has something for everyone. Here’s a look at the highlights.
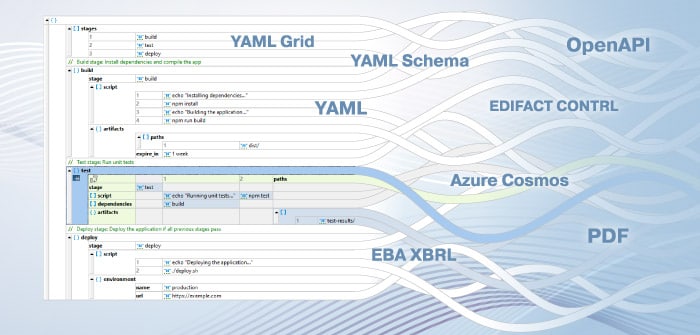
Run Altova Server Software on Azure Cloud
The Altova Server Platform is comprised of the complete family of Altova’s high performance server software for automating data processing and data integration workflows. These cross-platform server software products allow for flexible installation either on premises or in any private or public cloud infrastructure.
For customers utilizing the Microsoft Azure cloud, we’ve created a convenient, free VM template with the Altova Server Platform pre-installed for easy deployment, available on the Azure Marketplace.

How to Build Apps for Barcode Scanners
Handheld barcode scanners are indispensable in many sectors today, from retail and logistics to healthcare, shipping, and manufacturing. These devices play a critical role in capturing real-time data, such as inventory updates, order tracking, and customer details. However, integrating scanned data seamlessly into backend systems is just as important as collecting it. Barcode scanner apps can bridge the the gap with the ability to transfer scanned information to databases and business systems.
While the need to integrate barcode scanner data into mobile apps is a common requirement, building scanning apps is often a challenge. Traditional development methods require specialized expertise and can take too long, especially in industries that demand rapid deployment.
Support for connecting to barcode scanners in Altova MobileTogether changes all of that. With this low-code app development framework, you can create, test, and deploy barcode-scanning solutions in a fraction of the time compared to conventional coding approaches.

New in MobileTogether 10.0
The latest version of Altova MobileTogether introduces frequently requested support for building apps that connect to mobile barcode scanners. This addition makes the low-code development framework even more useful for creating solutions across industries that rely on barcodes and QR codes to update data in real time.
Version 10.0 also includes a new Styles Inspector in the app simulator, new controls, options for boosting flexibility and performance, and more.
Here’s a look at the highlights.

Modularization for App Development
In programming, modularization is the practice of dividing functionality into separate, independent modules. Modularization in app development is an efficient way of organizing app components and enabling collaboration within development teams. A modular approach also helps make testing, debugging, and maintenance of the app easier and more straightforward.
MobileTogether offers some classic – and some unique - approaches to modularization.

Learn About XQuery Update Facility
XQuery Update Facility is an extension of the XQuery language that allows you to make changes in an XML document using “update expressions” that insert, delete, replace, or rename nodes. This extension provides a convenient way to make intelligent updates to XML documents, and XMLSpy has a unique implementation that makes it even easier. Let’s see how it works.

Mapping Structured Data with Enhanced Node Functions
We’ve reported previously on support for node functions that simplify mapping structured data by eliminating need to copy-paste a function multiple times into a mapping. Repeating the same function unnecessarily clutters the mapping layout and makes the data mapping more difficult to understand or revise.
MapForce also includes additional filters are available for defining node functions. These parameters allow developers to apply functions and default values to specific nodes based on custom-defined criteria. For example, you can apply a node function based on node metadata such as the node name, node length, precision of the node’s data type, customized node annotations, and more.
Let’s look at a mapping with enhanced node functions.

YAML Editing Tools
YAML is increasing in popularity due to its combination of human readability, simplicity, and versatility. Often used in configuration files and for data serialization, YAML can be used alongside JSON and XML in modern systems. It makes sense, then, for developers to choose an IDE that supports all three standards.
New YAML tools in XMLSpy add to comprehensive support for XML and JSON development, giving users the flexibility to choose the most suitable serialization format for their specific use cases and preferences.
Let’s take a look at YAML support in the XML and JSON editor.

Version 2024r2 Introduces Support for YAML, FORTRAS EDI, and More
The latest release in Altova’s line of desktop developer tools and server software products includes support for new industry standards, updated database support, and performance optimizations.
With each new product version, we aim to provide customers with a mix of developer-requested features, support for emerging standards, and performance improvements. Version 2024r2 is no different, with tools introduced for working with YAML, FORTRAS EDI, and XBRL Report Packages as well as multiple performance and usability enhancements across the product line.
Here’s a look at the highlights.
