Fonts
The Fonts section of the Change Appearance dialog box lets you configure fonts for objects in the Chart window.
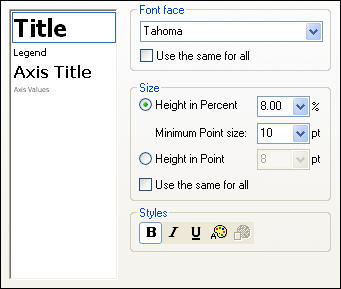
Font settings
You can choose the font face, size, and style for the individual elements displayed in the Chart window. You can define the size as a percentage of the chart size and define a minimum size in points, or specify an absolute value (in points). To apply the same font and/or size to all text elements, activate the respective Use the same for all check box.
The element names in the list box are defined as follows:
•Title: The name of a chart
•Legend: The key to the colors used in the chart
•Labels: The designation of the pieces of a pie chart
•Axis Title: The name of the X, Y, and Z axis in a bar or line chart
•Axis Values: The units displayed on an axis in a bar or line chart
•Tick Values: The units displayed on a gauge chart
•Values: The values displayed on the bars of a bar chart