How to View Workflow Automation Reports on FlowForce Server
Altova FlowForce Server is a high-performance workflow engine for automating enterprise-level data processing, data integration, and ETL jobs.
FlowForce Server includes a helpful web interface for managing and monitoring all aspects of data processing jobs, including in-depth logging functionality and a complete visual dashboard. Let’s take a look at how you can take advantage of FlowForce charts and statistics to monitor the progress of FlowForce Server jobs, as well as performance of the server itself, in great detail.

How to Monitor FlowForce Jobs
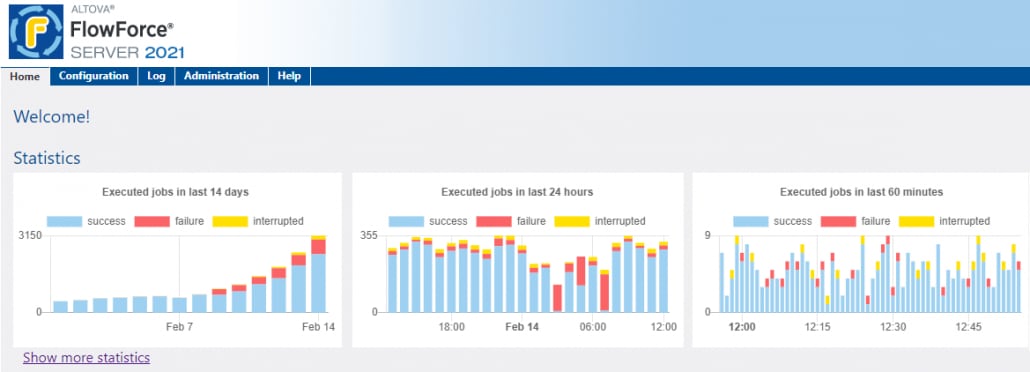
When you open the FlowForce Server web-based administration interface, the home page provides a quick view of the latest statistics and charts, as well as other helpful information including a list of recent and running jobs and a list of active triggers and services.
The charts and graphs you’ll find here give you a real time view of your FlowForce Server jobs and server performance, allowing you to:
- Understand the state of current FlowForce jobs at one glance
- Visualize the FlowForce Server load (how many jobs are executed per time interval)
- Visualize the fail ratio to understand how many jobs didn’t finish successfully
- See how many jobs were started via service URL and via time or file triggers
- To quickly note any abnormality in a number of executed jobs
- To quickly navigate to log view records in at a specific time interval highlighted in the results
Let’s take a closer look.
The Statistics section at the top of the home page displays graphs charting the number of jobs and their status in the last 14 days, last 24 hours, and last 60 minutes.

Job status reports are as follows:
- Success – the job instance executed successfully
- Failure – the job instance failed during execution (for example, an error was encountered, such as a non-existent path)
- Interrupted – examples include interruptions due to hardware or server failure
This is just a bird’s eye view – click “Show more statistics” to see more details about jobs executed at various time intervals…

…as well as the numbers and types of job triggers for the same intervals of time. The three types of triggers include:
- Timer – the job instance fired because it was programmed to run at that specific time
- File – the job instance fired because an HTTP or file system change occurred (for example, a new file was added to a directory)
- Service – the job instance fired because a program or a user called the Web service associated with that job

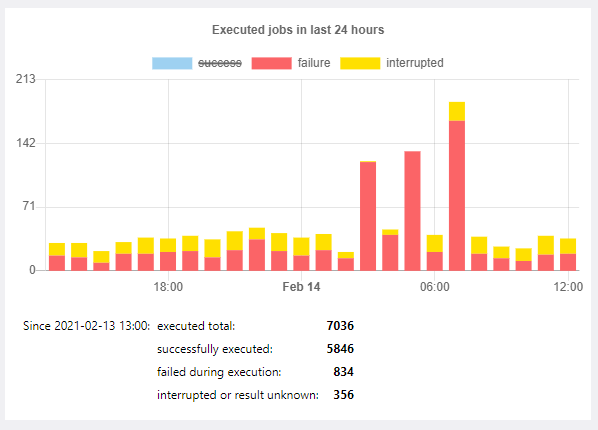
You can zero-in on the data you want to monitor, for instance, by turning off the jobs that succeeded to view those that failed during execution or were otherwise interrupted. To switch a stat on or off, simply click on its label in the chart.

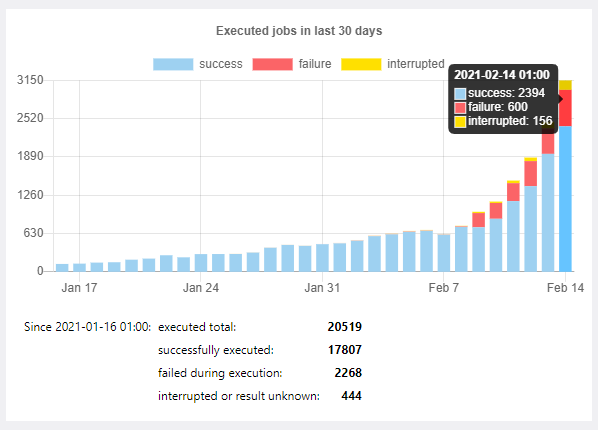
To view stats for a particular day, hour, or minute, hover your mouse over that moment in the chart:

To investigate a particular piece of information on a chart in more detail, click on the bar of interest in any of the charts to navigate directly to the detailed log page with the log pre-filtered for the given minute, hour, or day.
The charts and statistics dashboard for FlowForce Server makes it easier to monitor performance, identify issues, and troubleshoot by zeroing in on problems quickly.
Learn more about FlowForce Server and how it can be used to automate processing jobs of other Altova server software such as RaptorXML Server, MapForce Server, and StyleVision Server, all of which are available for a free, 30-day trial.
