On September 8, Altova released v2011 of the MissionKit with the addition of powerful reporting functionality across many of the products. Specifically, StyleVision has been supercharged with a multitude of new features, securing its place as an advanced and versatile business intelligence application, priced for today’s market. Let’s take a closer look at the exciting new features in StyleVision 2011 including:
- Charts as a new design element
- Chart wizard for XBRL files
- Explicit support for HTML/CALS tables
- Ability to import existing XSLT files
- Scripting & toolbar editor for Authentic®
Charts as a new design element StyleVision joins other MissionKit 2011 tools with support for charting, adding to its already advanced general purpose reporting capabilities to create a highly scalable decision support tool for XML, database, and XBRL content. As with all StyleVision designs, charts can be easily rendered for multi-channel output in HTML, RTF, PDF, Word 2007+, and electronic forms. The following types of charts are available:
- 2D & 3D pie charts
- 2D & 3D bar charts
- Category line graphs
- Value line graphs
- Gauge charts
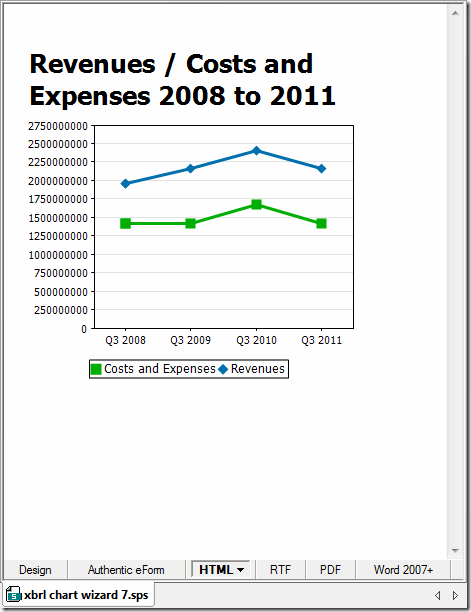
The chart configuration dialog lets you use XPath to select data for your charts. This can be as simple or as complex as you want, running the gamut from database data that is already laid out in a tabular format to XML files where the nodes you need to select are spread out over hundreds of lines of code. Pssst… if you’re thinking that this would be great for the unique demands of XBRL, read on because we created something special with that in mind ;). Here are a couple of examples of charts that you can build in StyleVision: 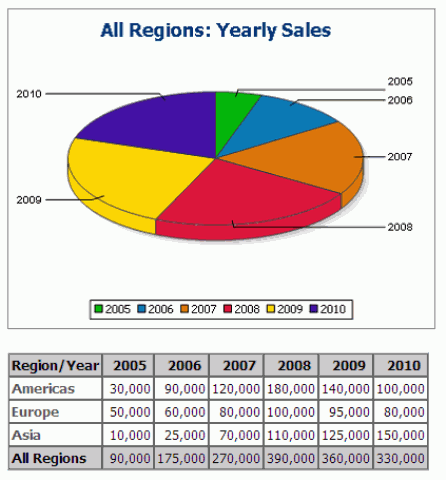
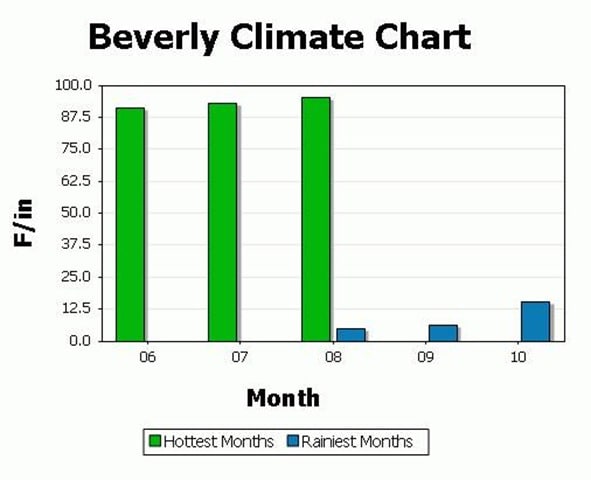 Yup, you can even chart completely different sets of data on the same graph. How creative you want to get with your visual analysis reports is really up to you. You can even create interactive charts for use with Authentic – allowing end users to manipulate eForms to view the desired result. For example, the screenshot below shows the Authentic view of a pie chart where a drop-down menu (combo box) selection dictates the subset of data that is represented.
 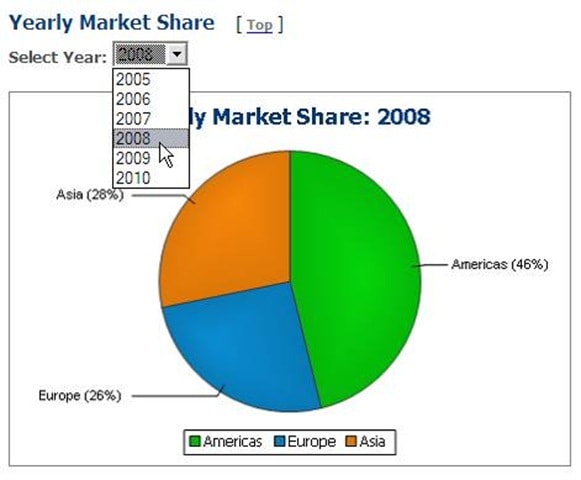 Charts are easily integrated into your StyleVision report templates at any point by simply dragging the relevant node onto the design pane and choosing Insert Chart from the context menu. The Chart Configuration dialog can then be used for chart settings (choosing chart type and style) and data selection (populating your chart axes with the relevant data from the source).
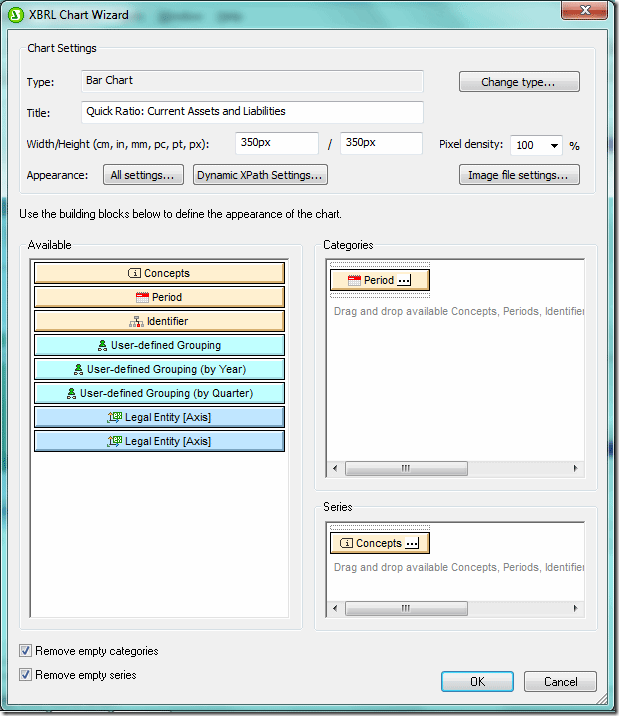
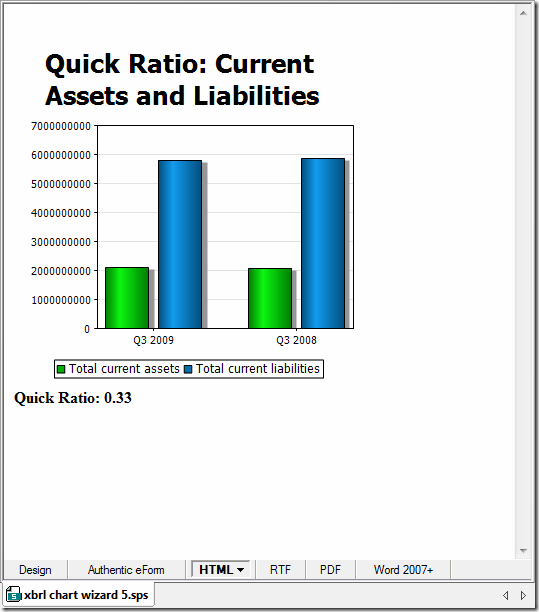
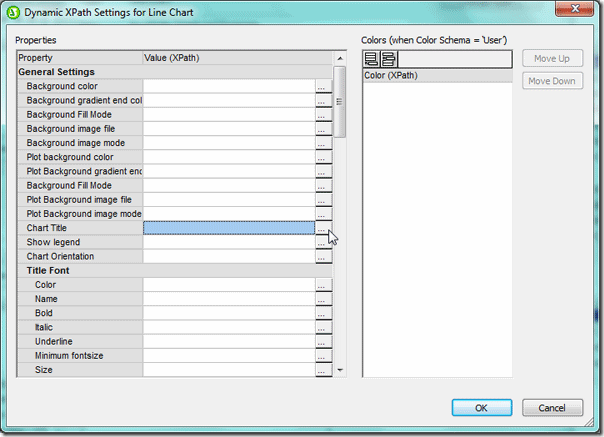
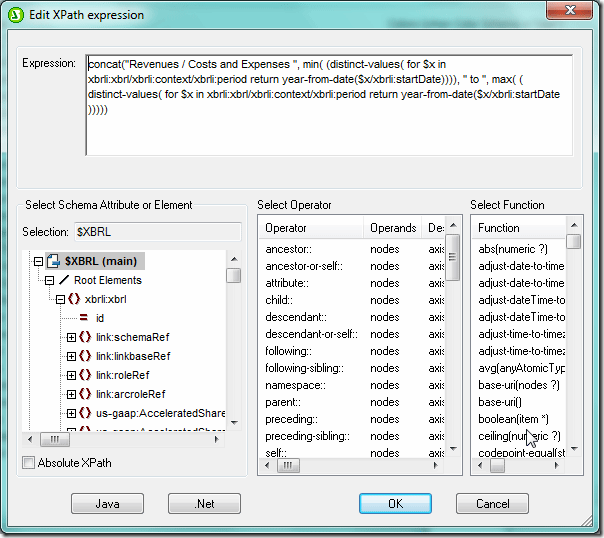
 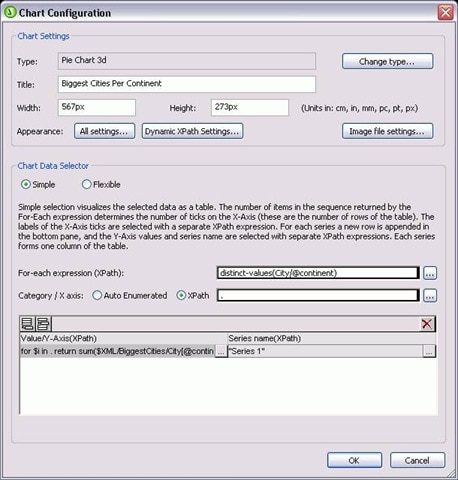 You can even use Dynamic XPath Settings to apply transactional data to your chart. Of course, if you sometimes have trouble telling your .s from your /s, you can always get some help with more complex expressions from StyleVision’s XPath Builder. Chart wizard for XBRL files If you are familiar with XBRL, you are intimately aware of the complexities associated with navigating XBRL taxonomies. And, if you’re impressed with what you’ve just read about StyleVision’s charting capabilities, you are probably trying to remember where you put that old XPath reference guide. Not to worry! StyleVision has added to its XBRL rendering support with an XBRL Chart Wizard that lets you easily select data and define presentation settings for your XBRL reports.
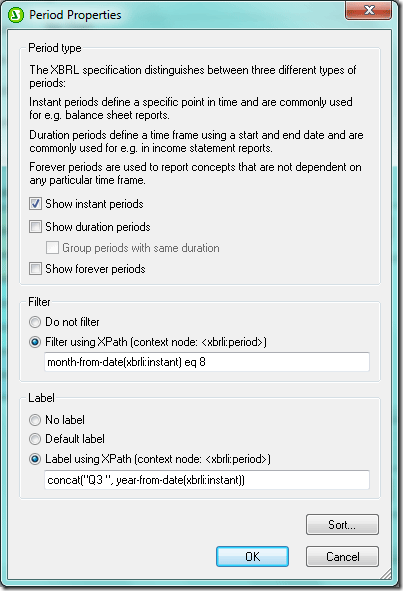
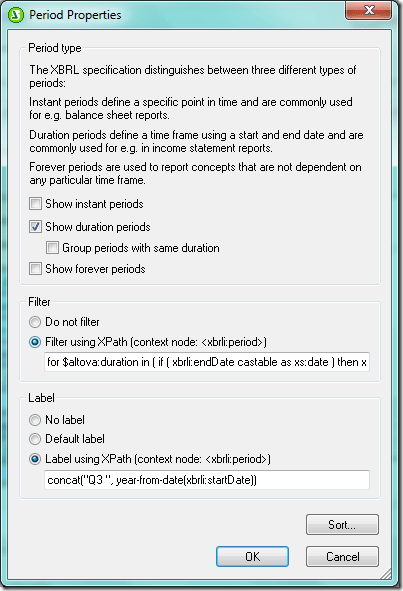
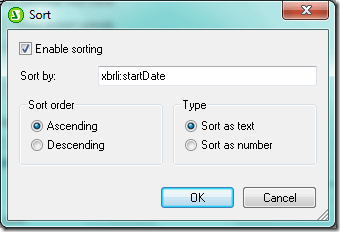
 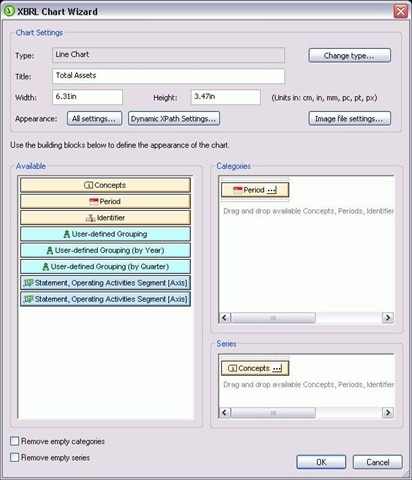 Concept and Period Properties dialogs are included to let you specify which elements should be included and how periods (instants or intervals of time) should be handled in your chart. Explicit support for HTML/CALS tables StyleVision now provides direct support for HTML/CALS tables, meaning that it will automatically recognize values dictating table structure (column number, row height, etc.) and apply them to rendered output. (v2011 adds support for rendering HTML/CALS tables in HTML, RTF, PDF, AND Word 2007+ – previous releases have supported output to Authentic eForms.)
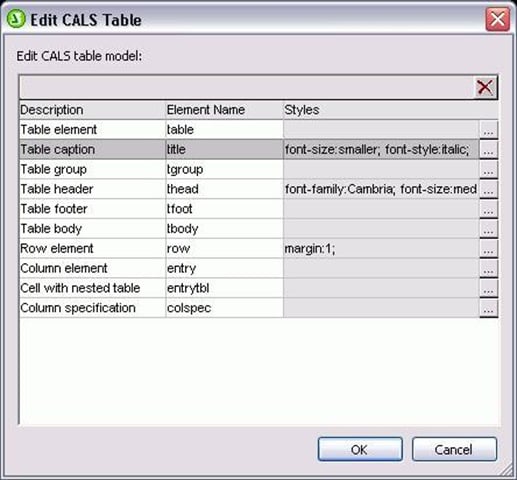
 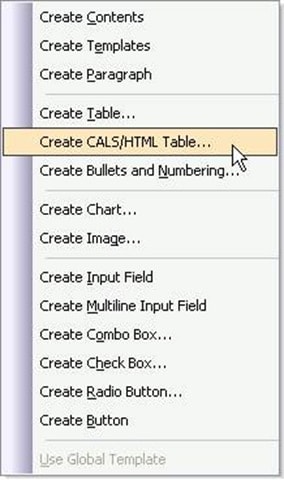 You can also easily assign additional presentation styles to HTML/CALS tables using the Edit CALS/HTML dialog.
  Ability to import existing XSLT files Well, I’m sure a few of you were hoping that this one was coming soon… You can now base your StyleVision template designs on existing XSLT files that were designed for HTML output or XSLT files with XSL:FO commands that were designed for output to PDF. Simply choose the New from XSLT File option and presto change-o, your design will be fully manifested in the design pane. Now you can edit your template using StyleVision’s graphical interface and output to even more formats (HTML, RTF, PDF, Word 2007+, and Authentic eForms) with just the click of a button. Scripting & toolbar editor for Authentic This feature is just way too cool not to devote an entire post to it, so keep your eyes peeled for a full description coming up on this blog. In the meantime, check out the Authentic scripting page for a brief description and examples. Better yet, just download a free 30-day trial of StyleVision today to test drive all of these new features for yourself!
 If you will be in Las Vegas next week for the 5th annual XBRL US National conference, be sure to check out the XBRL Data Forum for IT Pros & Developers. Altova is sponsoring this one day workshop that is part of the conference which consists of an intensive, practical day of discussion and presentation on XBRL d
 ata, databases and opportunities for IT professionals interested in expanding their technical knowledge in the growing area of XBRL.



 MACPA invested in the


