Tag Archive for: StyleVision

XML Reports to Text


Creating business reports from data stored in XML and relational databases is a common requirement in most organizations. However, it’s often complicated by the need to have information available in both web formats and print-ready formats such as PDF. Altova StyleVision takes a unique approach to report creation by letting users design reports from XML, databases, and even XBRL in a visual way – and output them in multiple formats simultaneously.

Over the years, support has been added for output to HTML, RTF, Word, and PDF – and now, based on customer feedback and requests, StyleVision also supports direct output to text. Let’s take a look at how it works.

Report designer
Read more…
Tags: , , , ,

NoSQL Database Support and More in Version 2022


Altova Software Version 2022 is now available, with exciting new support for mapping and converting NoSQL databases in MapForce, pure text report output in StyleVision, and Windows 11 across the product line. The release also adds support for the exciting new OIM standard from XBRL International.

Here’s a look at the highlights.

Read more…
Tags: , , , , , ,

New tools for JSON, EDI, SWIFT, and XBRL in Version 2021


As standards-based technologies and their applications evolve, so does the functionality that users require from developer tools. In our latest release, we’ve added new ways to work with XBRL, JSON, EDI, and more that help Altova customers work faster and more efficiently.

Let’s take a look at some highlights from the Altova Software Version 2021 release.

Read more…
Tags: , , , , , , ,

Build Advanced XML Reports with New XPath Debugger


Altova StyleVision is a unique, easy-to-use tool for creating business reports using a drag-and-drop visual design interface. StyleVision lets you build reports for XML as well as database and XBRL sources. Each design you create can be automated for recurring reporting to HTML, PDF and Word, either using the auto-generated XSLT stylesheet or via StyleVision Server.

Integral to XSLT stylesheet design is XPath for selecting and calculating data, as well as defining styling rules, in your report. New features added to StyleVision include an XPath debugger that makes testing and perfecting your report easier than ever. Let’s see how it works.

Developer working from home
Read more…
Tags: , , , , , , ,

How to Create Fillable PDF Forms


Compared to traditional paper forms, fillable PDF forms offer numerous benefits – aside from saving trees – including removing issues with legibility, allowing data validation, reducing re-keying errors, and streamlining information storage and re-use.

I, for one, really wish my kids’ school would switch to PDF forms for the myriad back-to-school information pages that we fill out in triplicate every fall. Perhaps I can give the administrators a demo of StyleVision, which just added support for fillable PDF form creation.

Unlike other PDF form design tools, however, StyleVision also provides form workflow functionality via integration with StyleVision Server for extracting and processing the data that end users enter. Let’s take a look at how it works.

PDF Forms

Read more…

Tags: , , ,

Converting a StyleVision Design to MobileTogether


StyleVision, Altova’s visual XSLT stylesheet designer and report designer, is also a powerful enterprise form designer popular with customers who need to get their XML or database data into e-forms for use with Altova Authentic.

Authentic is a WYSIWYG editor for non-technical users and is available in desktop and browser plug-in versions. However, due to increasing security issues, support for native plug-ins is being phased out in most modern web browsers. If you are an Authentic Browser Edition customer, fear not – you can now convert any existing StyleVision design to a MobileTogether design to deploy it via MobileTogether Server as a simple URL that can be accessed by web browsers, or even as a native app on a mobile device.

Let’s take a look at the advantages of that approach.

Enterprise Form to Mobile App
Read more…

Tags: , , , , ,

New XSLT Back-mapping Headlines Altova Release


It’s time for the latest release of Altova desktop developer tools and server software products, and this one introduces numerous innovative features across the product line, including a brand-new version of MapForce Server called MapForce Server Accelerator Edition for even faster processing of data integration jobs.

Let’s take a look at the highlights of Version 2017 Release 3.

Read more…

Tags: , , , , ,

Generate PDF, Word, or RTF Documents from a Mobile App


Need to empower mobile users to capture information and generate a document or report from any remote location? MobileTogether lets you build a cross-platform mobile app to do that. You can tailor the app with all the device-specific mobile controls users expect, like check boxes, date pickers, switches and buttons, yet generate output files identical to an existing document, form, or report already familiar throughout the enterprise.

The Actions Dialog in the MobileTogether Designer lets developers define a Print To action to generate PDF, Word, or RTF documents from a mobile app. Once a document is rendered, it is saved on the mobile client for further processing. For instance, a PDF file could be emailed as a file attachment.

Generate PDF, Word, or RTF Documents from a Mobile App

Read more…

Tags: , , ,

Big Data, Database, and XBRL Tools Get a Huge Boost


It’s time for the latest release of Altova’s MissionKit and server software products, and this one delivers a huge boost in functionality for working with big data, databases, XBRL, and much more.

With support for Apache Avro in multiple products, additional databases and drivers across the product line, and two new XBRL specifications in developer and server products, plus a new way to build and process PDF forms, Version 2017 connects all the data dots.

What will be your favorite new feature? Let’s take a look.

Big Data Support

Read more…

Tags: , , , , , , , ,

Starting Business Reports from Word


So much content these days is in the form of Microsoft Word documents. Word is where content or report creators often begin, and it has great tools for designing layouts and including images, tables and hyperlinks, and so on. What Word lacks though, is the ability to publish dynamic content or publish multiple versions of that content using the same template in an automated way, and that’s where Altova StyleVision comes in.

StyleVision is a unique product that is often difficult to describe because it does so much. Whether you want to auto-generate an XSLT stylesheet based on a visual design, create multi-channel business reports from dynamic XML or database data, or build user-friendly enterprise forms, StyleVision has you covered.

Starting with StyleVision 2016 Release 2, you can begin your StyleVision design based on an existing Word doc. Let’s take a look at why this saves an incredible amount of time, giving report and form designers the best of both worlds.

Designing a business report

Read more…

Tags: , , , ,

Rendering XBRL Table Linkbases using StyleVision


StyleVision provides the ability to quickly and easily generate multichannel renderings and reports of XBRL data. Because it employs a visual, drag-and-drop design model and includes numerous XBRL-formatting wizards, even stakeholders without deep technical XBRL expertise can leverage the full power of standards-based XBRL data to generate rich business reports on a one-time or recurring basis.  Starting with Version 2015 Release 3, StyleVision provides built-in support for rendering data according to XBRL Table Linkbase definitions. Let’s take a look at how it works.


Read more…

Tags: , , , ,

New Support for XPath/XQuery 3.1, WS-Security, and More Debut in R3


Release 3 of the Version 2015 Altova MissionKit desktop developer tools and Altova server software products is now available with updated standards support, customer requested features, and innovative new functionality that will save you time on everything from XPath and XQuery development, to advanced data mapping, to XBRL report rendering and beyond. You can skip right to the good stuff and upgrade now, or click Read More below for all the details.
clip_image005

Read more…

Tags: , , , , , , , , , , ,

Deploy Data Mappings and Report Designs for Automated Processing


Deploying data mappings created in MapForce and report designs created in StyleVision for automated processing by Altova server products is straightforward and quick.

The File menu in MapForce includes two options to optimize, preprocess, and deploy data mappings for MapForce Server and FlowForce Server. Preprocessing enables faster performance and reduced memory footprint for most data mappings.MapForce menu option to deploy to FlowForce Server Read more…

Tags: , , , ,

XPath Expressions for Data Reporting


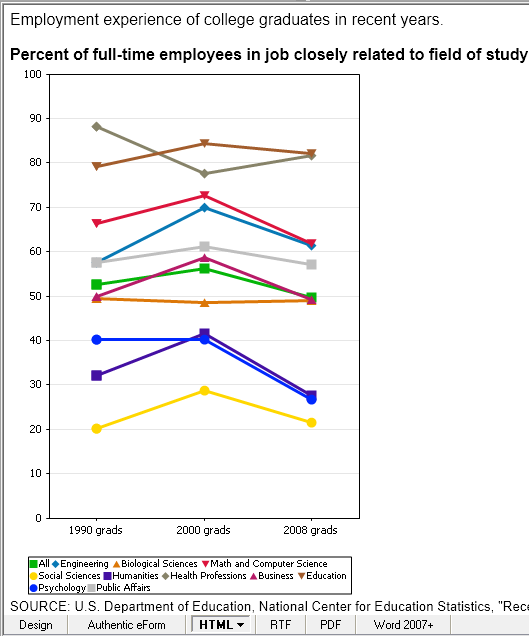
In our earlier post titled Use XPath Expressions to Refine Data Selection, we described how to use XMLSpy to develop an XPath expression to select one table of data contained in a much larger data set provided by the US Department of Education.

An HTML report based on XPath data selection in StyleVision

We can reuse the work in XMLSpy to quickly create a StyleVision design for a report or an e-Form to communicate highlights from the data.
Read more…

Tags: , , , , ,

Use XPath Expressions to Refine Data Selection


In this era of big data we often need to simplify analysis and communication by creating customized views into sections of a larger file. XPath, short for XML Path Language, is designed to allow users to address parts of large XML documents. XMLSpy supports XPath with an XPath Analyzer window and in its interface for charting XML data, MapForce supports XPath functions for XML data mapping, and StyleVision supports XPath in conditional templates, extension templates, and template filtering.

faces-laptop

Read more…

Tags: , , , , ,

Download Example Files for FlowForce Server, MapForce, and StyleVision


In response to an interested reader’s suggestion, the Altova MapForce mapping files and StyleVision stylesheet we deployed to FlowForce Server for the job described in the blog post Taming Bad Input Data with FlowForce Server are now available for download on the Altova Web site at www.altova.com/documents/AltovaBlogExampleFiles.zip

Altova MapForce and StyleVision sample files

Simply unzip the archive into a new folder and you’ll have all the data mappings, the stylesheet, and other supporting data files all in one place. A ReadMe file explains the contents. You can download fully functional free trials of Altova MissionKit and FlowForce Server at https://www.altova.com/download.html and implement and test FlowForce Server yourself.

Or, execute the data mappings in MapForce and the stylesheet in StyleVision to see how easy it is to extract meaningful information from the GPS data recorded by your own digital camera or GPS device. The example files in the download were also used in Web Service as a Look-Up Table to Refine GPS Data, XPath Enhances XML Reports, and others in our series on working with XML and Global Positioning Systems.

If you’re already an Altova MissionKit user, you can download these files with examples of Web services and user functions for MapForce, and XPath calculations and chart features for StyleVision, and add them to the extensive libraries of MapForce and StyleVision samples installed with Altova MissionKit tools.

Tags: , , , ,

The Altova MissionKit 2013 Introduces Seamless Integration of XMLSpy, MapForce, and StyleVision in Java Applications


The Altova MissionKit 2013, empowers developers to integrate XMLSpy, MapForce, or StyleVision functionality seamlessly in custom Java applications for Windows. This frequently-requested capability adds to existing support for integrating these MissionKit tools in Visual Basic or C# applications, giving developers flexibility to add some or all XMLSpy, MapForce, or StyleVision views and functionality to their own custom apps.

Version 2013 of XMLSpy, MapForce, and StyleVision include a new API that allows each to run inside a window within a Java application developed using the Java Abstract Window Toolkit (AWT) or Java Swing. This functionality allows MapForce 2013, for instance, to be embedded in larger applications where data mapping and transformation is only one requirement.

MapForce running in a Java ActiveX window

Altova provides sample applications with XMLSpy, MapForce, and StyleVision illustrating use of the Java API. You can access the sample applications from the command line or from within Eclipse.

Read more…

Tags: , , , , , , ,

Using Table Row and Column Conditions in StyleVision 2013


The ability to conditionally hide table rows or columns has been a popular feature request from StyleVision users. StyleVision 2013 adds the capability in the form of conditional expressions on table rows and columns. Conditional processing can be set on individual columns and rows of static and dynamic tables, as well as on column and row headers, to display or hide the column, row, or header depending on the truth of the condition. The conditions are specified using StyleVision’s XPath Expression editor. If a condition evaluates to true, the column, row, or header is displayed; otherwise it is not (i.e., is hidden).

StyleVision 2013 Edit XPath Expression dialog

Let’s take a look at some scenarios for which this new feature is exceptionally useful.

Read more…

Tags: , ,

Watermarks in StyleVision 2013


Watermark support has been added in StyleVision 2013, in response to customer requests. A watermark is text or an image that is displayed on the background of each page of a document section. Watermarks are often used in draft and confidential documents in order to emphasize a document’s status or security constraints.

In StyleVision 2013, watermarks may be used for print-oriented output formats, including PDF, RTF, and Word (Open XML). In keeping with StyleVision’s overall design model, with a single layout design used for multiple output types, you only need to define watermarks once, and they are applied to all print-output views.

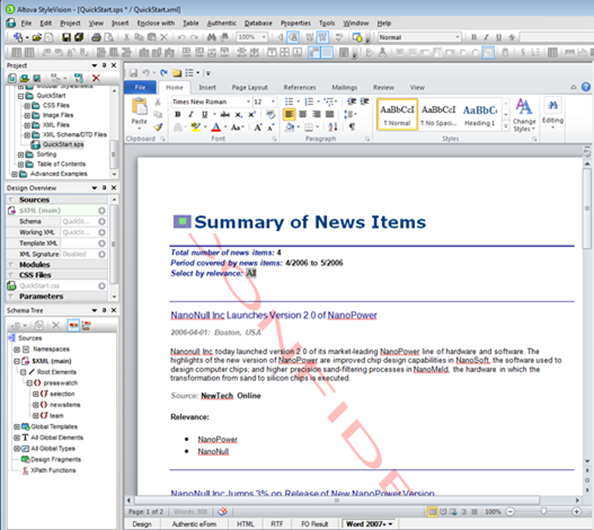
Here’s an example of a StyleVision design containing a watermark:

StyleVision 2013 Word watermark example

Let’s take a look at the steps involved in using watermarks in StyleVision 2013 by modifying the QuickStart example (quickstart.sps) included in the Tutorials folder (installed with StyleVision), in order to produce the design shown in the image above.
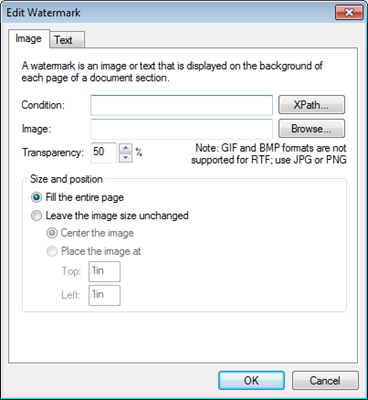
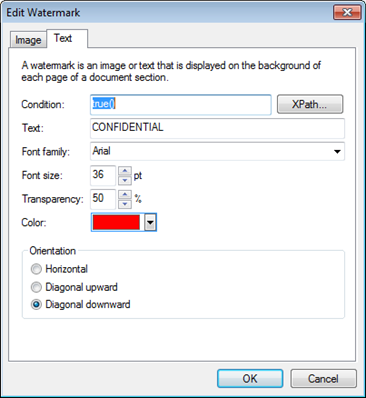
In the Design view, if you select “Edit Properties” in the Initial Document Section, you’ll see a new “Watermark…” button. Clicking the button presents the Edit Watermark dialog:

StyleVision 2013 edit image watermark dialog

StyleVision supports both image and text watermarks. For both types of watermarks, the general idea is to specify:
· A condition used to determine when the watermark should be included (which can simply be “true()” in order to include the watermark on all pages)
· The watermark content (image or text, with related attribute setting preferences)
· Watermark size and position settings

For our example scenario, let’s assume we want to place a red “CONFIDENTIAL” text watermark across printed pages. To do so, we click the Text tab in the Edit Watermark dialog and:
· Enter “true()” for the condition
· Enter “CONFIDENTIAL” for the watermark text
· Select red for the watermark color

StyleVision 2013 edit text watermark dialog

StyleVision’s support for watermarks is powerful and flexible. You can include both text and image watermarks, for example, with different XPath conditional expressions used to specify what should appear when. You can also specify different watermarks (or pairs of image and text watermarks) for each document section in a StyleVision design.

Check out watermark options and the other new features in StyleVision 2013 by downloading a free 30-day trial version today!

Tags: , ,

Web Service as a Look-Up Table to Refine GPS Data


Elevation data recorded by GPS devices is notoriously inaccurate, especially in hilly terrain like the Russian River Valley example from our earlier post.

The final elevation track plotted from the Russian River Valley GPX file is suspicious for several reasons. First, the graph shows we descended almost 50 feet below sea level. That’s hard to believe, since we were travelling along the bank of the river, only about 10 miles from the Pacific Ocean.

Altova StyleVision ChartSecondly, we were headed mostly west, following the river downstream, but the track shows a predominantly uphill trend.

We can evaluate the recorded GPS elevation data by comparing it to information available from the United States Geological Survey (USGS). The USGS operates a Web service that accepts latitude and longitude coordinates, and returns elevation data measured by NASA and assessed for accuracy based on over 13,000 control points in the continental United States.

Using the elevation Web service in an Altova MapForce mapping will let us extract each point from the GPX file, send the coordinates to the USGS Web service, and build a new GPX file with corrected elevation data.

Read more…

Tags: , , , , , , , , ,

Resist Data Integration Redundancy


The Internet makes massive amounts of data available for lots of interesting applications. But whenever you design a unique analysis and presentation of information you don’t privately control, you risk that the owner will offer the same view at some point in the future, instantly making your application redundant.

That’s exactly what happened to the Groupon API data-mining project we originally wrote about in August, 2011. Fortunately, the core of our project is a MapForce graphical data mapping. We can quickly and easily tweak the mapping and repurpose it to present an entirely different data set that provides new value.

HTML output from MapForce and StyleVision

Read more…

Tags: , , ,

XPath Enhances XML Reports


In our previous post on Creating Elegant Reports for GPS XML Data we used an XPath expression to select nodes from an XML document for an elevation line chart. You can also use XPath to compute values. Altova StyleVision includes strong support for XPath, and we can write XPath expressions to add interesting information to our GPS XML reports. For instance, we can process the elevation data stored by the GPS device in meters to plot a chart showing the elevation in feet above sea level instead.

Altova StyleVision line chart

Read more…

Tags: , , ,

Creating Elegant Reports for GPS XML Data


In our earlier post on XML for Global Positioning Systems, we mentioned that adventurers and athletes might want to use XML data from their devices to keep a record of their trips, or even training sessions leading up a marathon or other special event. Several colleagues responded by offering example files!

Looking through all this data, we realized that plotting elevation changes over time would show interesting results for many activities. We used XMLSpy to create this customized line graph directly from the XML data to show elevation vs. time for an afternoon of bicycling through California wine country. We even applied the vineyard photo as a background image right from the XMLSpy chart settings dialog.

Line chart generated by XMLSpy

Whenever you want to elegantly present data from multiple XML data files based on the same XML Schema, Altova StyleVision is the tool that lets you design a richly featured stylesheet for repeatable output in HTML, RTF, PDF, or Microsoft Word formats. Here’s how we did It for our GPS XML data:

Read more…

Tags: , , , ,

Building Web Pages – HTML Design with StyleVision


The rapid pace of today’s business environment means that information – along with the format in which it is required – changes often. Although some Web pages contain content that doesn’t often change (e.g., About Us and directions pages), the majority of today’s corporate Websites are continually updated with new data.
For this reason, many organizations choose to store Web content in XML. This allows organizations to develop content in a highly efficient manner because information in the XML file can be used for multiple purposes and in multiple output formats – the XML Schema associated with the XML file describes the content model.
StyleVision is a powerful stylesheet and report designer that can help you leverage XML. StyleVision will allow you to build Web pages with sophisticated formatting in a template-based, drag and drop design window. StyleVision auto-generates XSLT stylesheets so that you can integrate your design into a new or existing site – you can even generate ASPX Web applications right from the File menu.
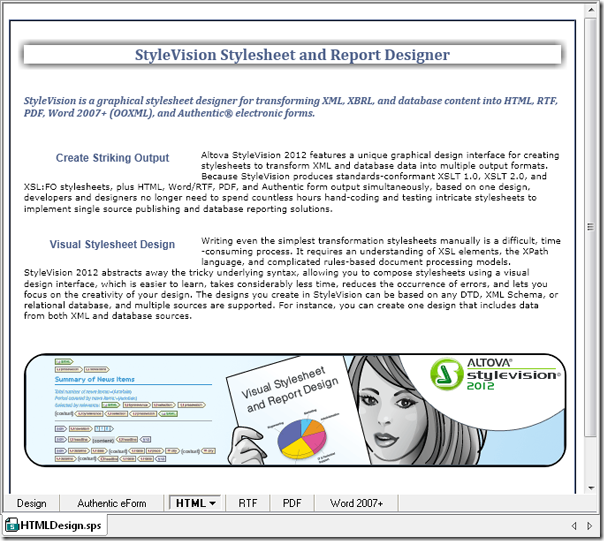
clip_image001

In this post we’ll design a Web page that will show off some of StyleVision’s HTML formatting capabilities. Although StyleVision’s built in formatting capabilities allow you to create sophisticated designs via simple drag-and-drop, for this example we’ll use CSS3, images, and other standard design elements to create a Web page that doesn’t need to be reformatted when content changes.

Read more…

Tags: , ,

New! XSLT Technology Training


We’re excited to introduce our new XSLT Technology training as the latest Altova Online Training offering. As with all our trainings, XSLT Technology is released as a free, self-paced course, available online, so students can fit it into their busy schedules.

XSLT transforms XML data into other formats, and this course will transform a beginner XML student into an advanced user. Intermediate and advanced students will gain valuable techniques to add to their XML toolkits.

clip_image002

Read more…

Tags: , , , , , , , , ,

Data Exchange for the Mobile Workforce


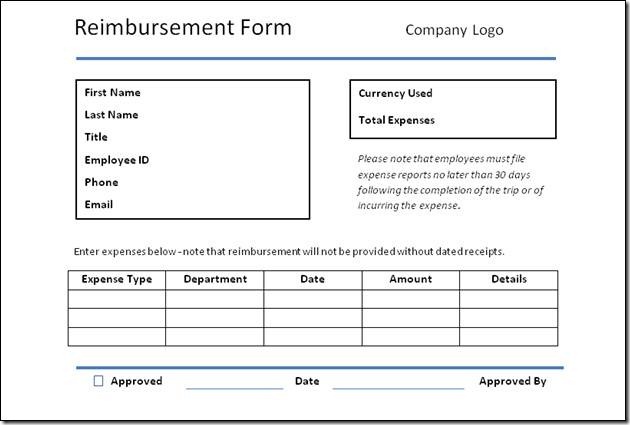
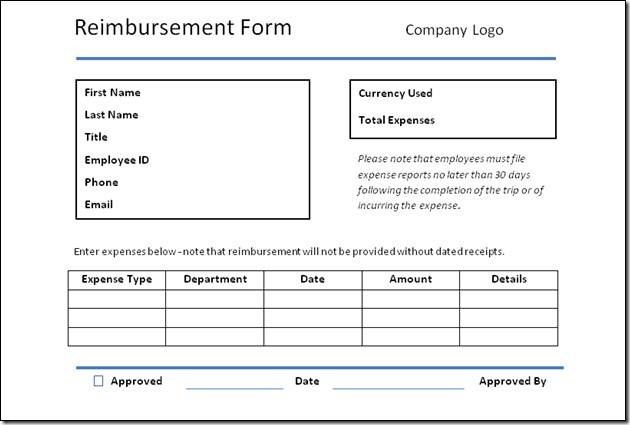
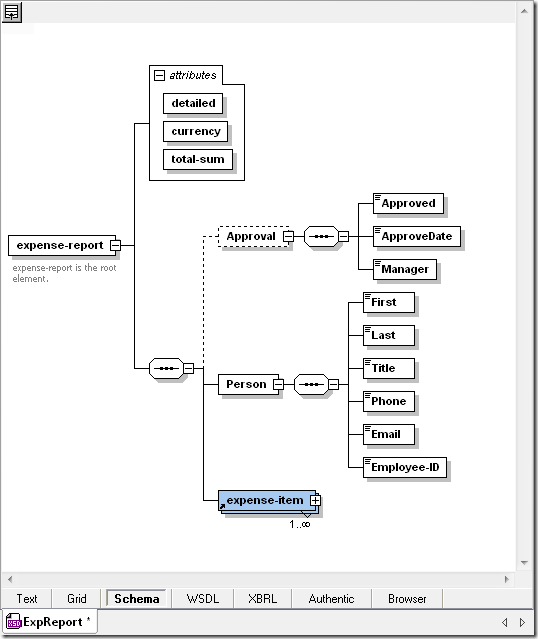
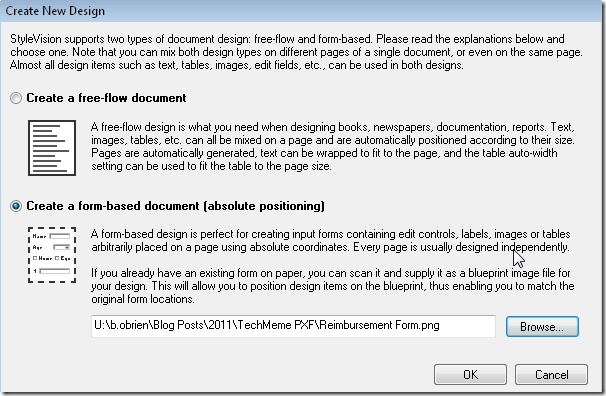
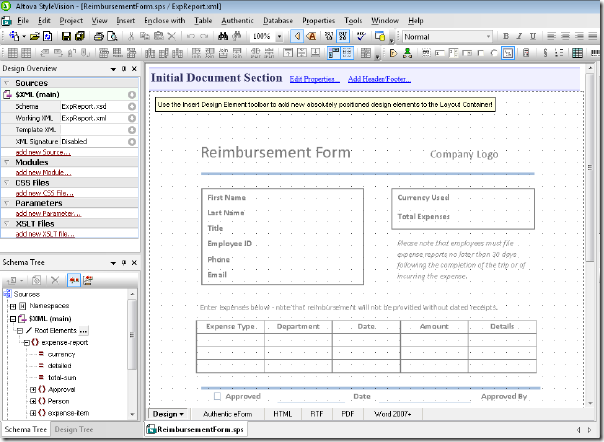
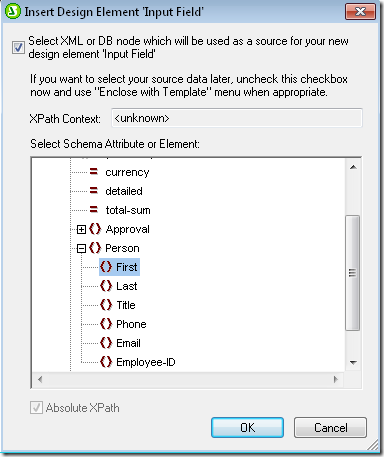
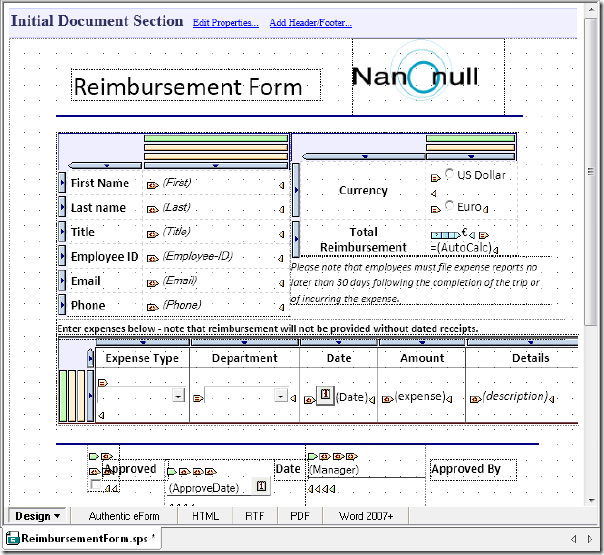
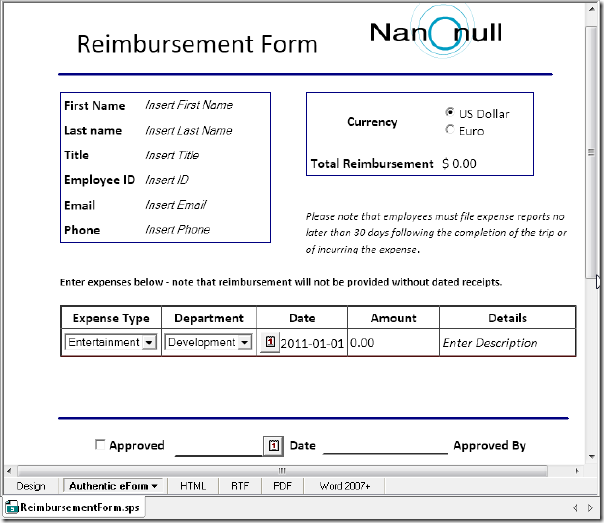
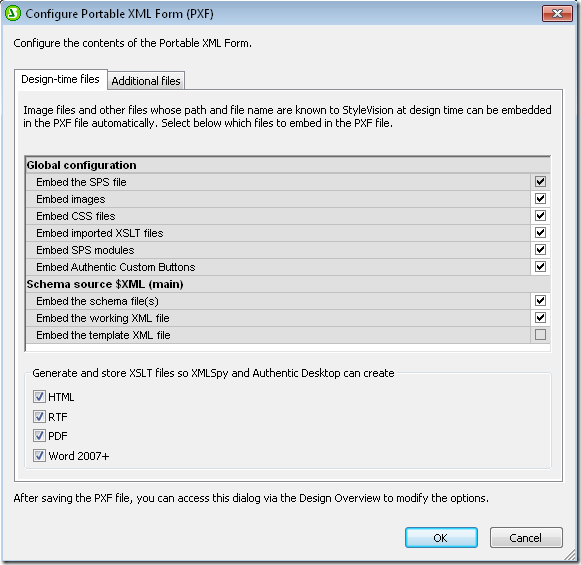
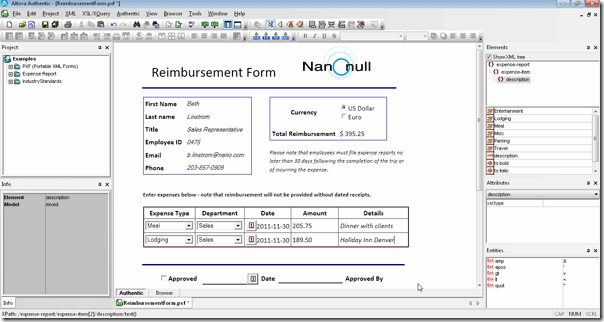
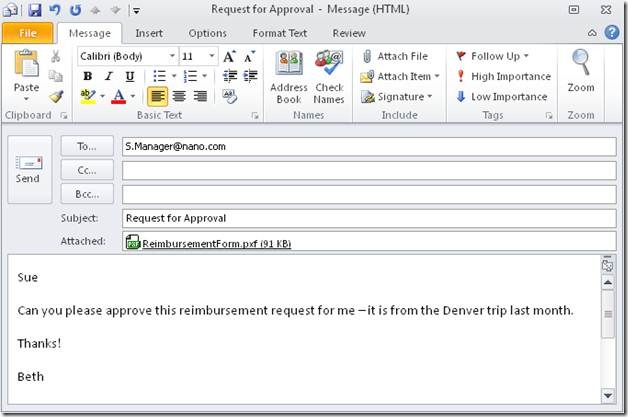
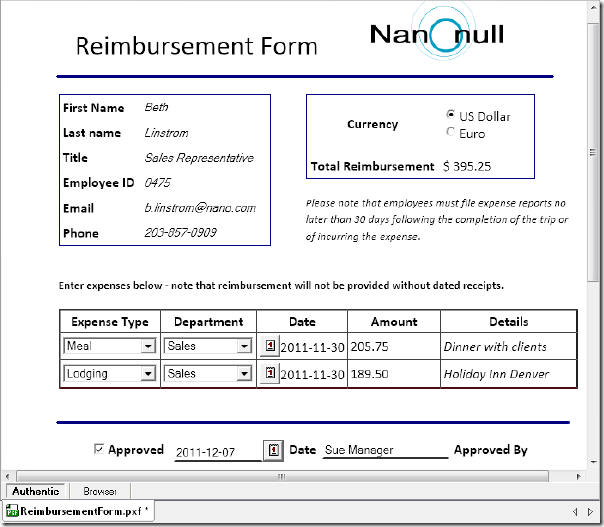
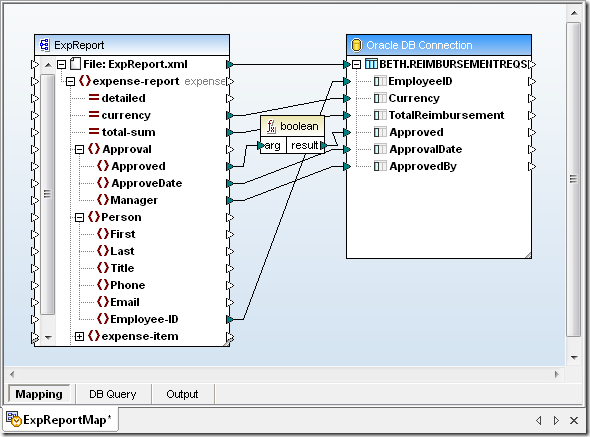
Data Exchange for the Mobile WorkforceOrganizations have been forced to adapt many of their internal business processes to accommodate an increasingly mobile workforce. Although there are technological solutions that address many of today’s communication needs, the plethora of different document formats in use – even within the same organization – means that some tasks remain vexing. For example, how does an organization remain flexible enough to facilitate the exchange of data among mobile workers yet retain the ability to bring that data into internal IT systems? Altova offers an inexpensive solution with StyleVision®, a graphical stylesheet and report designer with electronic forms capability, and Authentic®, a WYSIWYG XML and database editor in which end users can view and edit electronic forms created in StyleVision. The Authentic Community Edition is available from the Altova Web site as a free download so that anyone can be brought into your workflow, whether they are internal or external to your organization.clip_image002In this post we’ll present a sample case showing you how to create an electronic form that mirrors an existing paper form (in our example it is a reimbursement form) and then we’ll follow it as it makes its way around a fictional organization. Please note that the example we use here is simplistic and was designed only to illustrate the process of developing and deploying an electronic form. Although you can add additional data sources and perform validation and other complex functions in StyleVision, we have not illustrated these here.It is extremely easy to design electronic forms in StyleVision. To start, we simply select New – New from XML Schema/DTD/XML … from the File menu, browse to an XML Schema file, and select the type of design we’d like to create. For this example we created an XML Schema and instance file in XMLSpy, Altova’s XML editor and development environment, based on the fields on the paper reimbursement form. You can also base a StyleVision design on a database or XBRL taxonomy.Below is a copy of the reimbursement form we will be using along with the XML Schema we created.clip_image002clip_image003Once we select the XML file in StyleVision, we are prompted to select either a free-flow or form-based document. In a form-based document all design elements (e.g., text boxes for user input, images, buttons) are fixed in position – ideal for data entry forms.When we create a form-based document, we can upload a “blueprint image” so that we can recreate a paper-based form exactly as it was originally designed. This is the option we’ve selected below. The image will appear in the background of the design window and we will simply place design elements on top of corresponding elements on the form. Of course, the blueprint image overlay does not appear in the final output.clip_image004The screenshot below shows the blueprint image as it appears in the design window in StyleVision – how cool is that? clip_image005Now, using the Insert menu at the top, we can simply insert design elements onto the blueprint image in the design window.Available design elements include form controls (e.g., input boxes, combo boxes, radio buttons), images, tables, charts, and “layout containers” for exact positioning.We’ll start by adding input fields to capture employee information (i.e., First [Name], Last [Name], Title, etc. from the top part of the form). Once we click Insert – Insert Form Controls and select Input Field, the Insert Design Element dialog box appears.We have highlighted the First [Name] element in the dialog box below – the input field will now be associated with the First element. This way, when the end user types data into the input field and saves the form, this information will populate the First [Name] element in the XML file.clip_image006We now add design elements throughout the rest of the form, associating input fields with their respective elements from the XML file.When we are finished adding input fields, a logo, lines, a table for the expense items, and labels, the design looks like this – we’ve set the opacity attribute for the blueprint image to 0 to make it easier to view the design elements. Please note also that we’ve done some additional design work such as adding calendars in date fields, drop down boxes, and a currency sign that changes according to user input. For more information about fine tuning your form please see the StyleVision User and Reference Manual in the StyleVision application.clip_image007We can preview how the end user will see the form we designed in StyleVision by clicking on the Authentic eForm tab at the bottom of the design window (below). Note that the end user is prompted to enter data directly into each data input field. We accomplished this by placing the prompts (e.g., Insert First Name) in between the relevant tags in the XML file associated with our design. The end user simply highlights the prompt and replaces it with text.clip_image008Once we are finished designing the reimbursement form we can save the entire design – including the XML Schema and instance files, images, and any other associated files – in a single PXF® (Portable XML Form®). Saving the design as a PXF will enable us to email the form along with data updated in the underlying XML form among people both inside and outside the company’s LAN.clip_image009Once we hit OK we are prompted to select the files to include in the PXF. Notice that we’ve selected HTML, RTF, PDF, and Word 2007+ under the Generate and store XSLT files … heading. This will allow an end user to generate the form – with data – in these formats directly from Authentic.clip_image010Now that we’ve saved it in a PXF, the electronic form we designed in StyleVision is ready to be deployed in a business environment.In our example, we have a team of salespeople working across the globe who need to request reimbursement for business and travel expenses incurred. The salespeople complete expense reports, forward them to their managers for approval, and then send approved reports to the corporate office so that the information can be added into the accounting system.The PXF makes this easy.Once a salesperson is ready to complete a reimbursement request, she simply opens the PXF in Authentic and can immediately begin entering information onto the form. Below is a screenshot of a reimbursement form that has been completed in Authentic – notice that the form still needs a manager’s signature.clip_image011Now the salesperson must send it to her manager for approval. It’s easy to initiate an email with the form attached directly from Authentic. clip_image013Once the manager receives the email, she can simply double click the attachment and it will open in Authentic. Here the manager has clicked the Approved check box and added her name and the date.clip_image014The manager can then email the updated PXF back to the salesperson, who in turn emails it to the corporate office so it can be imported into the accounting system for processing. Our fictitious corporate office of course receives hundreds of reimbursement requests each day and has established a process for importing them into the relevant Oracle databases in the accounting system.We’ll use Altova MapForce, a graphical any-to-any data mapping, conversion, and transformation tool, to populate the corporate database with the data from the quotations. After setting up the mapping, we’ll automatically generate code from MapForce so that we can automate the transformation either through batch processing or a real-time conversion.First we’ll set up the mapping.We’ve inserted the XML file ExpRpt which we’ve extracted from the PXF into the left side of the MapForce design window and then inserted the Oracle database on the right side of the design window.Now we can drag and drop fields from the XML file with the reimbursement data into the Oracle database. We can also transform data, as we’ve done with the Approved element. Here we’ve used the built-in boolean function to convert the string value stored in the XML file (“true” or “false”) into the numeric equivalents (1 or 0). We can also create our own functions.The mapping we’ve created appears below.clip_image015Please note that this post offers a very broad overview of how to use both StyleVision and MapForce. Please visit the online training section of the Altova website for more in-depth instructions on how to use these and other Altova products.And there you have it. With the PXF, the fictitious Nanonull Corporation allows a group of far flung sales reps and their managers to easily exchange and edit information via electronic form. The PXF also provides a way for Nanonull to populate the accounting database without offering these employees direct access to company IT systems. All without busting the IT budget.

clip_image016

What could your organization do with a flexible, portable interactive document? Please share your ideas with other users by commenting on this blog post. Have you used StyleVision or other Altova products in an interesting project and think it would make a great case study? Email us at marketing@altova.com. We’d love to hear from you!

Tags: , , ,

Processing the Groupon API – Epilogue


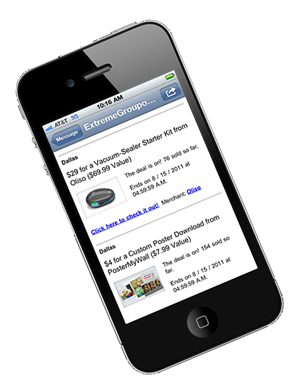
Rare edge cases can derail loosely coupled data mapping applications. This is especially true when you are consuming large datasets available over the Internet and have little or no influence over the source data. In this article we describe a debugging technique that lets developers working on data mapping and transformation projects quickly identify and accommodate unexpected data in a stream from a remote source. The Problem Last summer we wrote a series of blog posts describing how to work with the Groupon API to retrieve a subset of offers in all Groupon cities and format the list for a web browser or mobile device. MapForce output from the Groupn API, displayed on a mobile device We concluded with a command line to run a MapForce data mapping that calls the Groupon API over 150 times — once for each Groupon city, then filters the data to extract deals sold on the Internet instead of a physical location, and formats the results in HTML using StyleVision. Every morning we run the command line in a batch file that saves the HTML output on a local server so our colleagues can check it out with any Web browser to find interesting offers from all over the country. The mapping ran fine for more than two months until one day it failed with this error message: “Source-value “” of type dateTime could not be converted into target-type dateTime.” The specific explanation is that somewhere in the mapping where we expected a dateTime, we received an empty value. On a more abstract level, the error suggests a potential defect in the logic of our mapping strategy. Every time we call the Groupon API we receive a well-formed XML data stream enclosed in a <response> element, but the API specs do not include an XML Schema defining the data that may be returned. When we developed our mapping we needed to analyze the raw data and select the output we wanted, so our first step was to call the API to capture all the Groupon deals for one large metro area. We assumed we would get a large enough data sample to include every possible option in the API response. After our mapping ran successfully for two months, the API finally delivered a rare edge case that did not fit the pattern we expected. Debugging Tools MapForce provides debugging help. We can run our data mapping using the MapForce built in execution engine to see more details in the Messages window. MapForce Messages window siplays data mapping error The lines labeled Related location are hyperlinked back to components in the mapping where the error occurred. Clicking on the result error takes us to a format-dateTime function. format-dateTime function in MapForce We can either click the “” error or trace the value connector to identify the input element to the format-dateTime function. Either way, we locate the element that triggered the error. clip_image004 The suspect element resides in the input component that captures all the data returned by our calls to the Groupon API before any filtering or conversion takes place. When we designed the mapping, the endAt element in our sample data always reported the ending date and time for each Groupon offer, but for some reason we must have received an empty value in this field. If the error had occurred by running a local input file we could simply examine the file contents, but in this case the data came from multiple URLs, and is only held temporarily until it is mapped to the output component. Fortunately, we can apply a trick to easily modify the mapping and preserve all data received from the Groupon API. We simply copy the input component and paste a duplicate into the mapping. We can connect the response element from the original to the duplicate, which simultaneously maps all the child elements between the components. clip_image005 Our original input component is now connected to two output components. We can select which output component will be generated by the MapForce built-in execution engine by clicking the eye icon at the top right corner of any output component. The new output component simply saves a copy of everything in the input component. When we examine the raw data using XMLSpy, sure enough we find an empty element where we expected a date and time: clip_image006 The Solution Now that we know an offer might have no specific end time, we can plan for that possibility in the mapping. In the revised treatment of the endAt element, we do an if-test before the original format-dateTime function and provide an alternate output when the endAt element is empty. clip_image007 We had to work fast because all Groupon data is time sensitive. The edge case would eventually expire and disappear from the data stream. This experience showed us how important it is to have powerful debugging tools and to use them creatively, even after you think a data mapping project is running successfully! Altova MapForce is available in a free trial – the next edge case you solve could be your own. Editor’s Note: Our original series on mapping data from the Groupon API ran in three parts you can see by clicking the links here: Part 1 of Processing the Groupon API with Altova MapForce describes how to create dynamic input by collecting data from multiple URLs. Processing the Groupon API with MapForce – Part 2 describes how we filtered data from the API and defined the output to extract only the most interesting details. Processing the Groupon API – Part 3 describes formatting the output as a single HTML document optimized for desktop and mobile devices, and reviews ways to automate repeat execution.

Tags: , , , ,

Mastering Paid Keywords


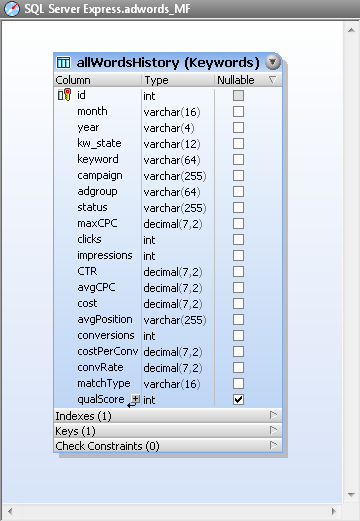
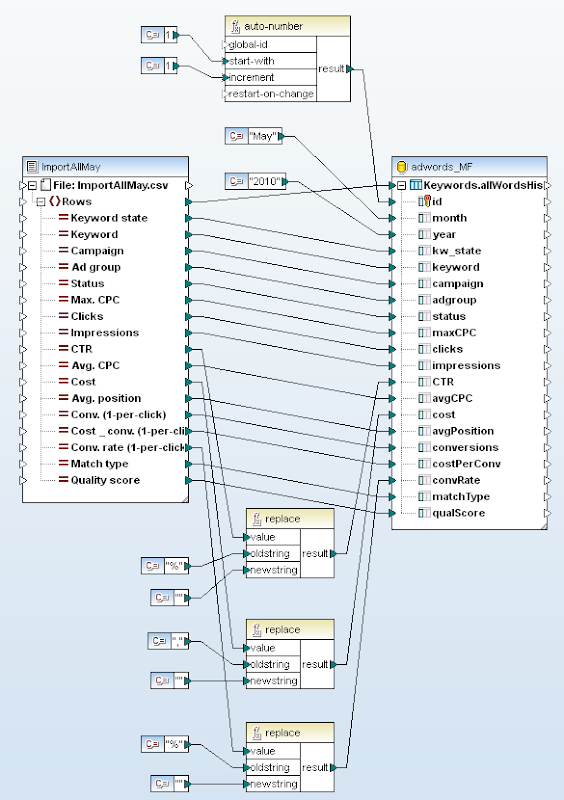
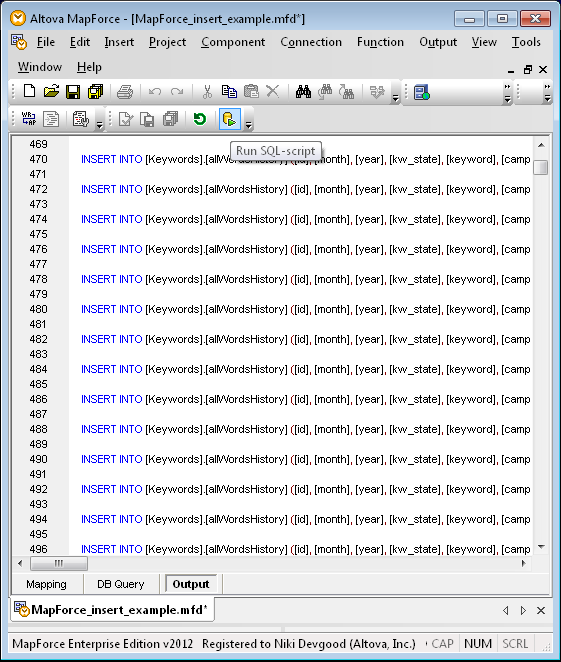
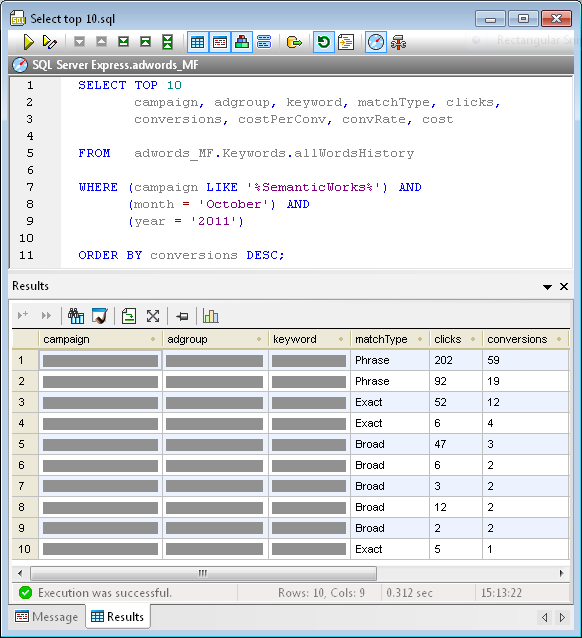
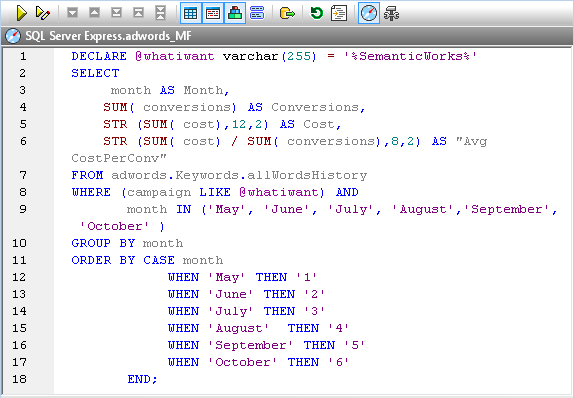
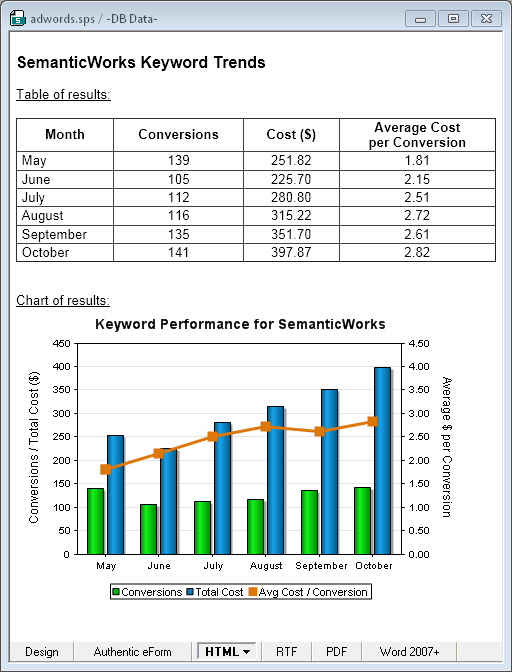
Anyone who manages paid keyword search knows it is hard work! You can look at vast reports of raw statistics and quickly get lost in trivia. At Altova we designed a better way to analyze and manage the performance data for our Google Adwords campaigns. We can creatively query the numbers to: · Quickly aggregate results for subcategories of campaigns, for instance by product, geographical region, or any other grouping · Easily identify trends over time The chart below illustrates these advantages by collecting data for a single Altova product – SemanticWorks – from multiple campaigns over six individual months. Keyword performance chart created with DatabaseSpy Starting Out Like many keyword advertisers, we were viewing statistics in Adwords, downloading CSV files, then spending hours massaging and manipulating the data in spreadsheets to identify and format the information we required. We wanted more immediate and in-depth reporting of keyword performance while retaining full control of the process and managing everything internally. SQL queries of a database of keyword statistics offer a powerful and flexible alternative. In the remainder of this post we explain how the database design, data mapping, and reporting features of the Altova MissionKit can be applied to create an architecture to efficiently track paid keyword performance. Database Design Our choices were to implement a keywords database on an existing database platform already running in the company, an express edition of a commercial database, or an open-source database, since the Altova MissionKit works with SQL Server®, MySQL®, Oracle®, IBM DB2®, PostgreSQL®, Sybase®, and Microsoft® Access®. We chose SQL Server for our database platform. We connected with DatabaseSpy and used the graphical database Design Editor to create the table shown below. DatabaseSpy graphical table design Most columns correspond to fields in a keywords report. In order to store multiple rows for each individual keyword – one row for every month of statistics – the table also includes columns for the month and year. Populating the Table The Google Adwords online interface lets users create reports of keyword statistics of specific date ranges and download them as CSV files. We downloaded individual CSV files containing our performance data for each unique month. We used MapForce to map values from the CSV files to columns in the database table and insert the month and year data for each row. Keyword report mapping in MapForce The string functions at the bottom center of the mapping diagram remove percent signs and commas from fields we want to treat as numerical data. By doing this in the mapping, we don’t have to massage the columns of data in the CSV files before importing them. Since the CSV files for each month all have the same structure, the mapping needs only minor revisions to import each new month’s data: update the constants at the top that define the starting row id, month, and year. MapForce processes the mapping with its built-in execution engine, reading the CSV input and generating SQL INSERT statements for each row of data. MapForce then allows users to execute the entire generated SQL script by clicking a toolbar icon or from a selection in the Output menu: MapForce database insert script Querying the Database Back in DatabaseSpy, we can query the database from the SQL Editor window. This query reports the top ten performing keywords for SemanticWorks in October 2011. For data privacy, some fields in the Results chart are hidden. Results with table To get additional interesting results, the SQL statement can be easily modified. For instance, the ORDER BY line can sort for highest cost, most clicks, or any other characteristic. The WHERE statement combines data from multiple campaigns. The LIKE keyword treats the percent signs around SemanticWorks as wildcard characters to match any campaign with SemanticWorks anywhere in its name. Other queries could add a geographic identifier such as US or EU, or match on an entirely different column such as adgroup. Of course, all these options depend on a consistent and predictable campaign and adgroup naming system. We created a DatabaseSpy Project to collect all our favorite SQL queries for sharing and convenient reuse. Here is the query we used to generate the chart right in DatabaseSpy that appears at the top of this post: ChartQueryCapture This query goes beyond simple SQL reporting to perform calculations on a subset of the data and format the results. Database Reports We designed reports for the executive team using Altova StyleVision, based on the queries and charts we had already designed in DatabaseSpy. We simply copied our queries from the DatabaseSpy SQL Editor window and added them as sources in the StyleVision Design Overview window. Saving our report design in a StyleVision SPS stylesheet makes it is easy to regenerate an updated version every month. Here is the HTML output for a SemanticWorks Keyword Trends report based on the query above, displayed in the StyleVision Preview window: clip_image009 If you follow the conventional wisdom for building your own paid keyword campaigns, you will develop segmented campaigns with many small, highly specialized ad groups, and you may also find yourself overwhelmed by the data in Adwords reports. If you’d like to try managing your own keywords the way we describe here, a fully functional trial of the Altova MissionKit is available.

Tags: , , , , ,

Meet the Altova Team at Oracle OpenWorld


clip_image002Some people say early October brings the most enjoyable weather to San Francisco, and Oracle OpenWorld and JavaOne will make things even better this year from Oct. 2 – 6. If you’re traveling to the City by the Bay for either event, plan to visit the Altova team at booth 106 in the Moscone South Oracle OpenWorld exhibit hall. We’ll be demonstrating all the tools in the Altova MissionKit with special emphasis on multi-database support, tools for working with XML in databases, and solutions for compliance with XBRL, NIEM, HL7, EDI, QR codes, and many other industry standards. Here’s your chance for a personal tour of that Altova tool or feature you’ve been curious to see – whether it’s advanced charting in StyleVision, Java code generation from UML in UModel, or refactoring XML Schemas in XMLSpy. We always enjoy meeting users face to face and hearing about the projects you’re working on too! You can also enter our Altova product raffle for a chance to win a license for Altova MapForce 2011 Basic Edition. We hope to see you there! clip_image003

Tags: , , , , , , , , ,

Processing the Groupon API – Part 3


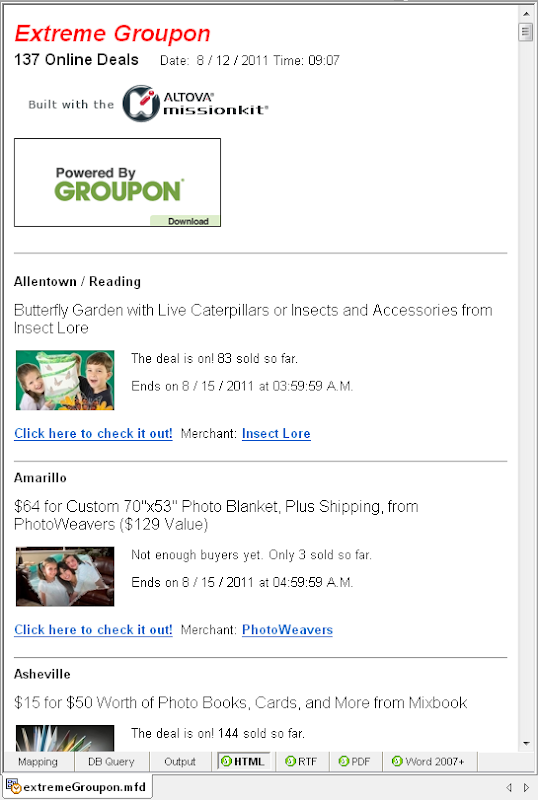
Concluding the series in this post, we will apply a stylesheet to transform the XML data created from our mapping of the Groupon API into HTML. Here is an example of the XML output from the data mapping we created last time: XML produced by MapForce from the Groupon API

Assign a Stylesheet to Transform XML The Component Settings dialog for the output component of the MapForce mapping allows us to assign a stylesheet created with Altova StyleVision.

Assigning a StyleVision Stylesheet to a MapForce component
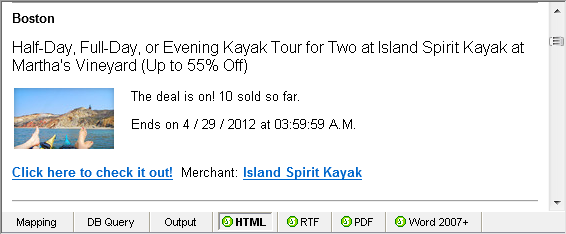
Assigning a stylesheet to the data mapping output component integrates the operations of MapForce and StyleVision, and a new series of buttons appears at the bottom of the MapForce mapping window for HTML, RTF, PDF, and Microsoft Word formats. (You must have both MapForce and StyleVision installed on your computer.) MapForce ouput formats available through a stylesheet When you click any of these output format buttons, MapForce executes the data mapping exactly as we saw in the previous post. MapForce seamlessly passes the XML output to StyleVision, where it is transformed to the selected format. MapForce then displays the formatted document in the Output window. Here is the MapForce Output window for HTML, based on the StyleVision Power Stylesheet assigned above: HTML output produced by MapForce from the Groupon API The MapForce Output menu lets you save the XML data mapping output or the HTML document formatted according to the stylesheet. How to Make a Stylesheet We designed a stylesheet for the Groupon API data mapping using Altova StyleVision, based on the XML Schema for the MapForce output component. The intuitive StyleVision interface and powerful data access and manipulation features make it easy to create attractive documents in HTML, RTF, PDF, and Microsoft Word formats from XML files. The screenshot below shows the StyleVision Design View of the Extreme Groupon stylesheet. The blue numbered circles identify the location of each design feature listed following the image. StyleVision stylesheet for the MapForce Groupon API mapping Features of the SPS file

  1. User-defined html specifies the viewport meta tag for mobile devices. This lets us design one stylesheet to generate a single HTML file for computers and mobile devices
  2. Document title with customized font, size, and color
  3. An autocalc element uses the XPath count function to count the number of deals in the XML input document and inserts the total
  4. The date timestamp is placed at the top of the document even though the date element occurs at the end of the XML input data file
  5. Images from the Altova and Groupon Web sites are referenced by hyperlinks, not as inline image data
  6. Horizontal rules set off each individual deal. For HTML documents, the rules automatically fit the browser window width
  7. Customized fonts and sizes assigned to different elements
  8. A two-column table organizes each deal description
  9. URLs in the XML file are dynamically assigned as hyperlinks for embedded images, fixed text, and dynamic data

StyleVision Power Stylesheets can combine multiple .xsd files, existing .css stylesheets, database schemas, XBRL taxonomies, and more to produce richly formatted reports that can even include automatically generated charts in various styles. You can also use StyleVision to define e-forms with data entry fields, drop down menus, radio buttons and other advanced features. Previewing Stylesheet Transformations StyleVision lets you assign a working XML file to preview your output as you design the stylesheet, and the buttons along the bottom of the Design window make it convenient to display the formatted working file as you refine your design. We saved the XML output of the MapForce mapping and assigned it as our working document. When the stylesheet was complete, the HTML Preview in StyleVision was identical to the MapForce HTML Output window shown above. To view the document on a mobile device you can either deploy the HTML as a page on a Web site or email it as an attachment. HTML version of the MapForce mapped data on a mobile device In addition to the stylesheet itself and formatted versions of the working document, StyleVision lets you save generated XSLT files to transform other XML files using your stylesheet design outside the StyleVision application. Automation Next Time In the future when you want to re-run a data mapping and refresh the HTML document with up to date data, there are two ways to automate the process:

  • You can run MapForce from a command line with parameters to name the mapping definition file and even call StyleVision to create formatted output
  • You can generate royalty-free code for the mapping in XSLT, Java, C++, or C# to combine with the XSLT code from StyleVision to build your own end-to-end application

XMLSpy, MapForce, and StyleVision are all available together in the specially priced Altova MissionKit. See for yourself how easy it is to use the MissionKit to convert data from a Web API — download a free 30-day trial!
Editor’s Note: Our original series on mapping data from the Groupon API ran in three parts you can see by clicking the links here: Part 1 of Processing the Groupon API with Altova MapForce describes how to create dynamic input by collecting data from multiple URLs. Processing the Groupon API with MapForce – Part 2 describes how we filtered data from the API and defined the output to extract only the most interesting details. Processing the Groupon API – Part 3 describes formatting the output as a single HTML document optimized for desktop and mobile devices, and reviews ways to automate repeat execution.

Tags: , , , , , , , ,

The Maryland Association of Certified Public Accountants (MACPA) transforms data to XBRL in-house


What is XBRL and how can it help your organization? Members of the Maryland Association of CPAs (MACPA) found out how using the interactive XBRL (Extensible Business Reporting Language) format can help not only larger, public companies, but also smaller, non-profit organizations like themselves.clip_image004 MACPA invested in the Altova MissionKit tool suite to support their XBRL project. Using our XMLSpy XML editor; MapForce, our graphical data mapping, conversion, and integration tool; and the StyleVision visual stylesheet and report design tool, MACPA was able develop a comprehensive system that employs XBRL data for a variety of reporting functions, both internal and external.
For example, MACPA used the generated instance document from MapForce to populate their financial Key Performance Indicator (KPI) system, significantly reducing the amount of time and effort required to prepare the KPI documentation. XMLSpy was used to extend the US-GAAP taxonomy to accommodate entries specific to MACPA. clip_image002 MapForce also came in handy for mapping the Global Ledger (GL) Taxonomy to the extended GAAP taxonomy. clip_image004 As a result, MACPA has increased its working knowledge of XBRL, automated previously burdensome data collection and transformation tasks, and have gained more insight into their financial data. To read more about how MACPA utilized the Altova MissionKit to convert all their financial data to XBRL and create a model for public and private business of any size to leverage the powers of XBRL, the latest case study from Altova is a must read! Do you have a story to tell about your use of Altova tools? If so, we want to hear from you. Case studies generate great publicity. Check out recent press coverage from the MACPA case study. Plus, if we choose to use your story you will receive a $200 Amazon gift card!

Tags: , , , , , , ,

It’s Here – the Industry’s First Truly Portable XML Form


Hopefully by now you’ve downloaded the 2011r3 versions of the Altova product line released last week. We’ve introduced a bunch of new features and functionalities that put even more power into the hands of IT professionals. (Note: If you haven’t already done so, you can download the latest versions of all of the tools in the Altova product suite from our Web site.)clip_image004One of the features we’re most excited about is the new Portable XML Form (PXF) file for StyleVision and Authentic. The PXF is a file into which all elements required to support a StyleVision design including XML Schemas, database connections, images, etc. can be embedded. Imagine the possibilities! In this post we’ll take an in-depth look at the PXF file format as well as some use cases.

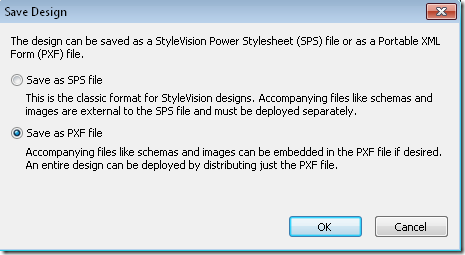
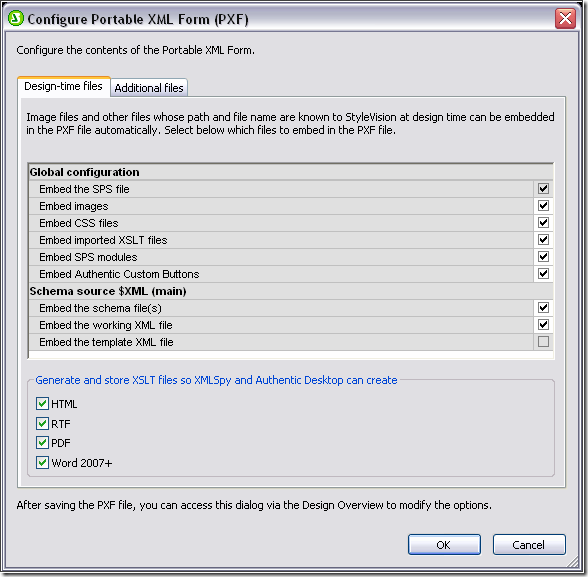
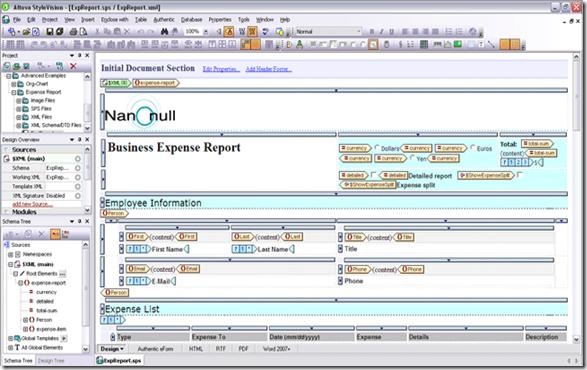
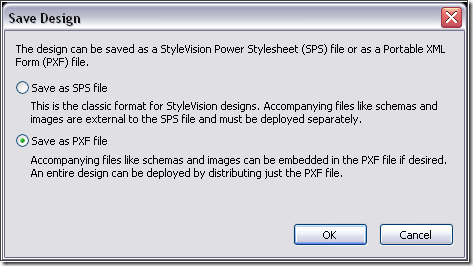
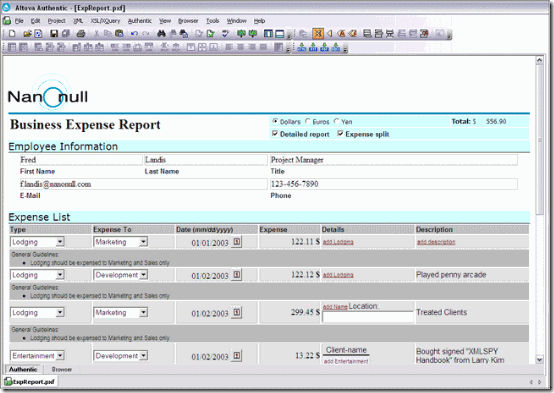
When you create a design in StyleVision and then save it as a PXF file, all design elements including XML Schema and instance documents, SPS design files, XSLT, images, and other external files are embedded in the PXF. The PXF file can be transported, downloaded, copied, and saved like any other data file, meaning that developers no longer have to send or install multiple files to support a design. This is especially useful for integrating Authentic electronic forms into your projects – and consequently great news for business users. Authentic electronic forms created in StyleVision allow business users to edit databases and XML files without wrangling with database and XML syntax. The PXF file makes developing – and using – these forms even easier. Take, for example, the bane of many a business traveler’s existence – the expense report. Fortunately for the IT professional using Altova tools the expense report is a snap – a developer can create an eye-catching report that meets the business needs of the client by taking advantage of StyleVision’s many design capabilities. clip_image002 Once the design is complete, creating a PXF file is as easy as selecting Save As and toggling the Save as PXF file radio button. clip_image003 When prompted to select files to embed in the PXF, remember to check the output formats that end users will be able to publish content in. clip_image004 With all design elements now embedded in the PXF file, you can distribute the form easily and efficiently.

  • Is the expense form going to be integrated into a larger project? Send the PXF file to the development lead, who will be delighted at receiving a single file rather than a bunch of individual files.
  • Do business users need to access the expense form online? Rather than saving the XML Schema, instance documents, SPS, images, etc., to the server separately, simply put the PXF file on the server – everything needed to deploy the design is in the PXF.
  • Ready for QA to test it? Email the PXF to the team. They will be able to deploy it simply by opening the PXF in Authentic, just as a business user would. The schema is embedded in the PXF so you can rest assured that XML and database content is being edited and updated appropriately.
  • Are you dealing directly with the end user? Email the PXF to him – the Authentic Community Edition is free and easy to install so a business user can distribute the form and all associated files and data to relevant stakeholders across the organization.

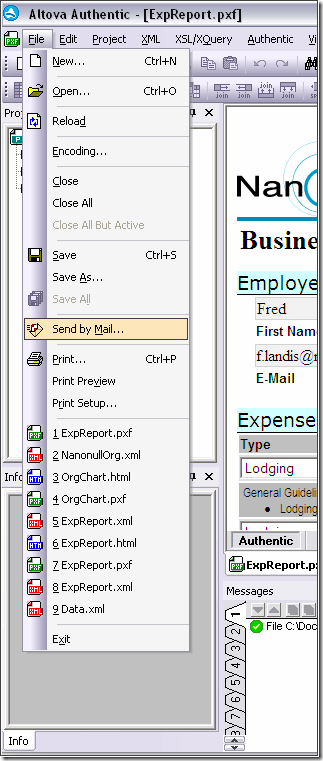
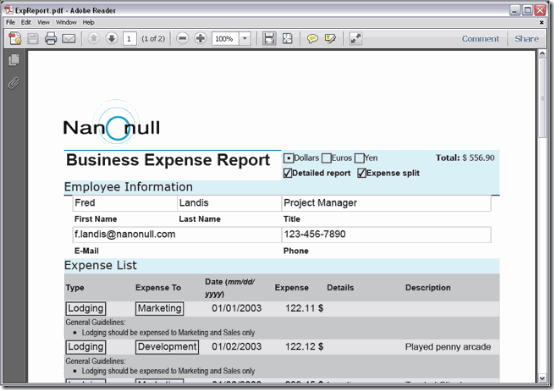
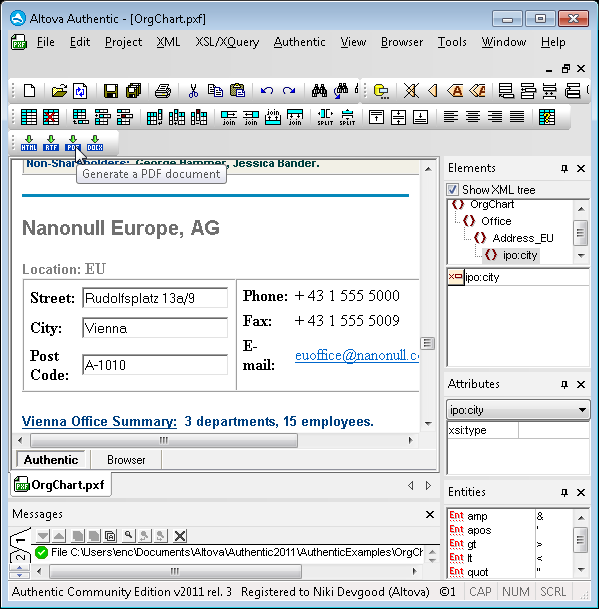
The PXF is a boon to business users as well as developers. Depending on how you deploy the expense report, business users can access it via Authentic Desktop or in their browser with the Authentic Browser Plug-in. As he would with any Authentic form, an end user simply opens the PXF file in Authentic Desktop and can immediately begin editing or adding data. The associated XML file or database is updated automatically to reflect the changes. End users accessing an Authentic form via the Authentic Browser Plug-in likewise update XML and database data by entering and editing information in the form. clip_image005 The value of the PXF for end users is the same as for the developer – portability. Because the PXF file contains all of the files necessary to support the Authentic form, including the instance document, the business user can enter his expense data, resave the file, and then send the PXF to the accounting department. He can even email the PXF directly from the application. clip_image006 The PXF file also provides business users with the ability to publish content in multiple output formats. In our example the developer clicked HTML, RTF, PDF, and Word 2007+ in the Configure Portable XML Form (PXF) dialog box. A business user can instantly create an output document in each of these formats by clicking one of the output buttons on the menu bar. clip_image007 Here we’ve clicked the PDF button, generating a document that a business traveler can mail to the corporate office, keep for his records, etc. clip_image008 Although the portability afforded by the PXF significantly increases the value of electronic forms by simplifying the process of getting critical business data into XML, Authentic forms in general are an easy sell to business users. In addition to comprehensive editing capabilities, Authentic enhances the business value of electronic forms through features that include real-time validation of input data, industry standard XML templates, project management support, and dynamic layout based on user input. In addition to all of the functionality and editing capabilities Authentic offers, the application can compete on price – the Authentic Community Edition is free. We hope that you are as intrigued by the possibilities offered by PXF as we are. By providing developers an easy way to integrate electronic forms into their projects and a simple (and free) way for business users to distribute and publish information, PXF could radically transform the process of creating and editing XML and database content. This is a truly exciting prospect. For those of you not yet using our tools, this is a perfect time to give them a try. Click here to download free, fully functional trial versions of our software. They’re good for 30 days!

clip_image009

Have you used the PXF form yet? How did you use it? Please share your story with other Altova users by commenting on this blog post. Think it would make a great case study? Email us at marketing@altova.com. We’d love to hear from you!

Tags: , , , ,

Release 3 of Altova Software Version 2011


  New in Altova MissionKit 2011r3 PXF (Portable XML Form), XML digital signatures, and HIPAA data mapping are just a few of the many exciting new features we’ve introduced today with Release 3 of the Altova MissionKit 2011 and complete product line. Let’s take a look at some of those now. First…what on earth is a PXF?

What is PXF?

PXF is a new file format that – finally – makes editable XML forms truly portable. PXF files are configured in StyleVision 2011r3, where a developer creates a design that generates an interactive electronic form that can then be accessed and edited by non-technical business users in Altova Authentic (or in the Authentic View in XMLSpy). When the StyleVision design is saved as a PXF, the XML Schema(s), XML instance(s), electronic form, etc., are all embedded in the PXF file. The PXF can even optionally include the XSLT files autogenerated by StyleVision that allow the business user to publish his data in HTML, Word, RTF, and/or PDF – with a single click. After a PXF file has been created, it can be transported, downloaded, copied, and saved like any other data file. Portable XML Form Why PXF? The benefit of the PXF file format is that all the components required for editing XML content – and for the generation of output reports from Authentic – can be conveniently distributed in a single file. And, since Authentic Community Edition is a free product, PXF deployment couldn’t be more affordable. Authentic interface There are countless usage scenarios for the PXF file, but one example is to allow a business user to easily get important data into a valid XML document and send it back to the requester or to another department, such as HR or Accounting. The user receives a PXF file by email and opens it in Authentic. The XML file will be displayed in Authentic using the embedded StyleVision eForm design, and can be edited using the word processor-like Authentic interface with access to advanced interactive options, context sensitive entry-helpers, business logic validation, and more. The File | Save command saves changes to the PXF, i.e., the embedded XML is modified and saved. The File | Send by E-mail command makes it easy to send the updated PXF on to another user with a single click. In addition, when XSLT files associated with the SPS are included in the PXF, Authentic toolbar buttons let the user render his data in multiple formats for publishing or further communication. PXF takes the headache out of getting critical business data into XML – without sacrificing any of the benefits that XML brings to data integration and extensibility.

XML Digital Signatures

To address the growing need for security around XML transmissions, v2011r3 includes support for assigning and verifying XML digital signatures through the implementation of W3C XML Signature technology across multiple MissionKit tools. An XML Signature enables digital authentication for XML transactions by checking the integrity (whether the data has changed since it was signed) and the authenticity of origin (the identity of the signer). In contrast to other digital signature methods, XML Signature is uniquely suited to working with XML data because it includes measures for canonicalization, which involves signing the important data while ignoring inconsequential changes such as whitespace and line endings. In XMLSpy 2011r3, it’s easy to add an enveloped, enveloping, or detached signature to your XML-based files using either certificate e or password-based authentication. Create XML digital signature You can also verify signature(s) on files received. If the file changed at all since it was signed, verification will fail. Verify XML Signature Other MissionKit tools with XML digital signature support include:

  • MapForce 2011r3: When your data mapping project has XML or XBRL output, you can create an XML digital signature that will be added to output file produced when the mapping is executed.
  • StyleVision 2011r3: StyleVision designers can configure Authentic eForm output to allow XML instance files to support XML signatures.
  • Authentic 2011r3: When an Authentic eForm designed in StyleVision has XML signatures enabled, the Authentic user can sign XML data using an enveloped or detached signature as well as verify any XML signatures present when documents are loaded.

HIPAA Data Mapping

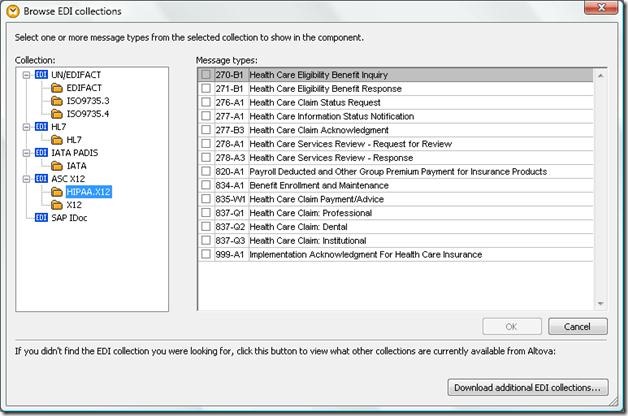
In addition to new features for Excel® data mapping and other enhancements, MapForce 2011r3 now includes native support for mapping HIPAA 5010 data. Health care enterprises that send or receive HIPAA information will be able to apply MapForce 2011 Release 3 to meet a number of requirements. Users of legacy healthcare IT systems that do not store data files internally in a format compliant with the latest HIPAA standard can use MapForce 2011r3 to map incoming HIPAA 5010 transactions to the enterprise internal format or database. Or, a MapForce mapping can be designed to generate HIPAA-compliant transactions for output from existing non-compliant data. If the enterprise wants to translate legacy healthcare data for internal storage in HIPAA 5010 format, MapForce 2011 Release 3 is the tool for that one-time transformation too! HIPAA EDI mapping Native HIPAA support adds to current support for HL7 (Health Level 7) and other EDI standards. Check out all the features added in the latest Altova release, and stay tuned for more details here on the blog.

Tags: , ,

StyleVision Supports XBRL for Financial Reporting Part I – Creating GAAP-Compliant Reports and StyleSheets with a Single Click


Did you know that StyleVision is also an XBRL rendering and reporting tool that will allow you to create GAAP-compliant financial reports with the click of a button ? image
In this post we’ll show you how …

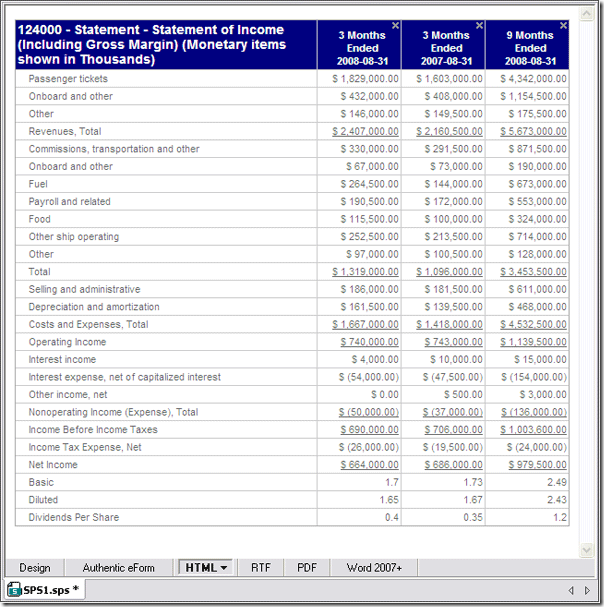
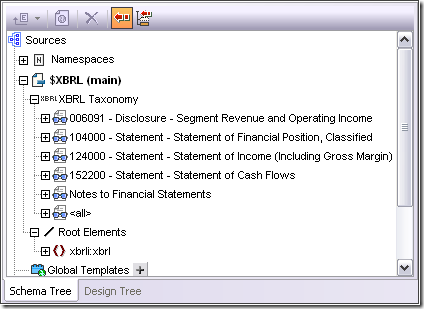
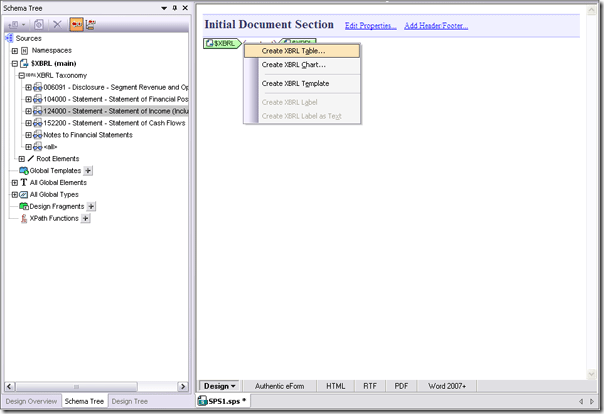
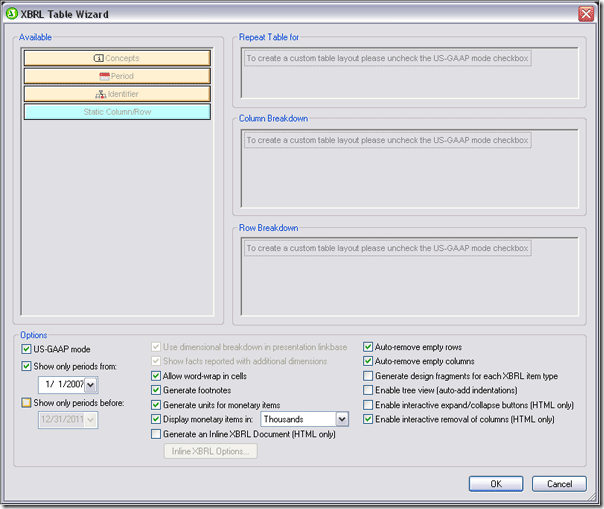
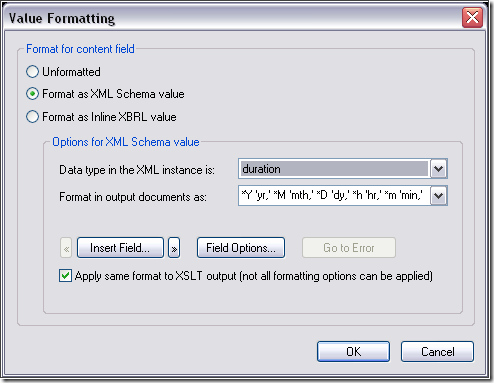
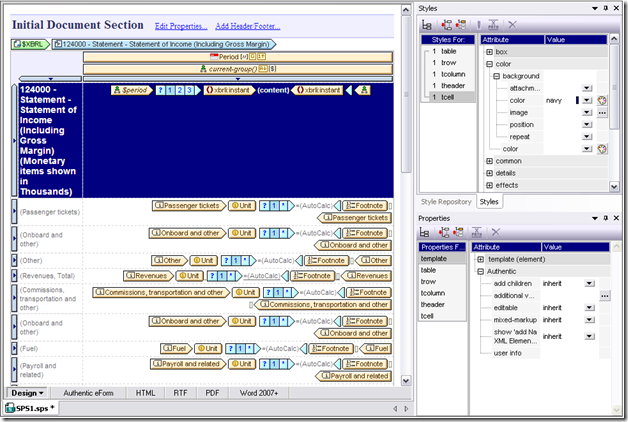
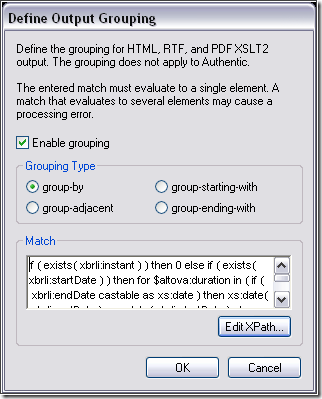
Altova’s native support for XBRL is great news for IT professionals serving a range of industries given the US Securities and Exchange Commission’s (SEC) formal embrace of XBRL as a financial reporting language. In fact, virtually all public companies using GAAP accounting will be required to submit financial data for fiscal periods ending on or after June 15, 2011 to the SEC in XBRL, an XML-based language. IT professionals will be called upon not only to facilitate the exchange of data but to render XBRL data in a manner intelligible to business users. StyleVision can help. With a number of built-in capabilities that allow you to create customized GAAP-compliant stylesheets and reports for XBRL data with only a few clicks, StyleVision can make you look like a technical – and accounting – whiz. When you create a new design from an XBRL taxonomy, StyleVision creates a schema tree that reflects the presentation linkbase, an XML file that includes sets of related concepts grouped under presentation links (e.g., in the example below, 006091- Disclosure – Segment Revenue and Operating Income is a presentation link). Typically the presentation linkbase will appear in the schema tree as discrete financial statements, addendums, disclosures, and the like (this will depend on the contents of the linkbase – and keep in mind that although standard not every XBRL taxonomy will have a linkbase). Individual root elements are also available for reporting/processing and appear below the presentation links. image To create a stylesheet or report, drag the appropriate presentation link into the design window (for this example we have selected 124000 – Statement – Statement of Income (Including Gross Margin)). You will be prompted to create an XBRL table, XBRL chart, or XBRL template. image Selecting Create an XBRL Table will invoke the XBRL Table Wizard. image Note that under Options we have US-GAAP mode checked. If you check the US-GAAP mode box StyleVision will generate a table with all of the financial data in the presentation link selected. (You can select which period you would like represented under the Options tab as well). Output in HTML, RTF, PDF, and Word 2007+ formats, plus corresponding stylesheets, are automatically generated once you click OK. Although there are a number of formatting options in the Table Wizard, once the table is generated you can make additional changes (e.g., background color, font, text, table borders, etc.). In the example below we highlighted the <xbrli:instant> element and used Value Formatting to change how the time periods are represented. In the XBRL instance document, the time period appears in YYYYY-MM-DD – YYYY-MM-DD format. We have changed it to [Number of] Months Ending YYYY-MM-DD. image Notice the Styles window in the screenshot below – we’ve also changed the table header’s background color to navy and the text color to white. image Sorting, grouping (via XPath), and filtering (via XPath) options can also be edited after the table is generated by the XBRL Table Wizard. Simply right click in the Period or current-group bar above the table header and select the appropriate function. The Group by … dialog box appears below. image The GAAP-compliant table rendered in HTML appears below. image The HTML output above reflects the formatting options we selected in the XBRL Chart Wizard:

  • As indicated in the header, monetary items are shown in thousands because we selected Thousands in Display monetary items in under Options
  • We checked Auto-remove empty rows and Auto-remove empty columns so there are no empty rows or columns
  • Because we selected Enable interactive removal of columns (HTML only) under Options in the XBRL Chart Wizard the end user can click the “x” in the corner of a column to hide it
  • We did not select Enable tree view so the labels are all left justified and do not reflect the hierarchy of the schema
  • We did not enable Interactive expand/collapse buttons so they do not appear

One last thing to note is that in our example we have selected the entire presentation link 124000 – Statement – Statement of Income (Including Gross Margin) and all data in that presentation link is populated to the table. However if you expand the presentation link in the schema tree you can select individual line items or those grouped together from a presentation link and create a mini-table. This is just an overview of how you can use StyleVision’s built-in GAAP-compliant functionality to render XBRL data in some simple ways – the possibilities for presenting this data are virtually limitless. In future posts we’ll discuss using the XBRL Table Wizard to combine multiple line items from different presentation links for highly customized data presentation, creating powerful charts with the XBRL Chart Wizard, and other ways to help organizations leverage their XBRL data (we’ll even provide an example of how XBRL financial data can be used with other data sources to create an annual report).

clip_image001

Have you used Altova tools to create XBRL solutions for your clients? Please share your story with other Altova users by commenting on this blog post. Think it would make a great case study? Email us at marketing@altova.com. We’d love to hear from you!

Tags: , ,

Using the StyleVision Combo Box to Support Data Visibility Requirements


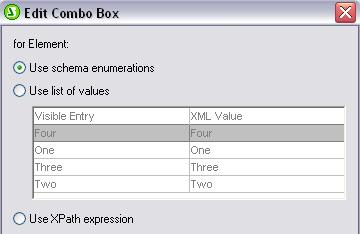
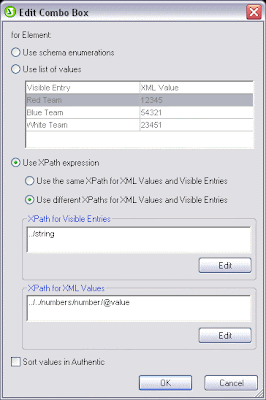
Altova is always on the lookout for ways to help software developers and architects meet the challenges presented by the increasingly complex collection, storage and retrieval requirements of end users. In fact, we recently enhanced the functionality of the combo box in StyleVision to provide developers with additional flexibility around collecting and populating data. There are three ways to define the items in a combo box and their associated XML values – automatically based on a valid schema, manually with a list of populated values and dynamically with an XPath expression. In the latter two scenarios, the value that appears to the end user can be different than the value that will populate the file or database. This feature is particularly useful in cases where the “meaning” of the underlying data isn’t obvious or intelligible to an end user (e.g., a seven digit part number). The values in a combo box can be automatically populated with enumerations from a valid schema. In this case the value that appears to the end user is identical to the XML value that will populate the file or database.Altova StyleVision The functionality is perfect in cases where the elements in the schema provide an accurate reflection of the data content as understood by multiple stakeholders (e.g., end user selects Four to indicate group assignment, which populates the file with the XML value Four). Developers can also populate the combo box manually, defining both the value that appears to the end user and the XML value that will populate the file or database. These values do not need to be the same. So, for example, an end user can select Acme Dishwasher, Stainless while a complex product code populates the file or database used to generate the purchase order. This is an especially useful for collecting standardized data using organization or department-specific taxonomies and supporting multi-lingual applications. Finally, combo boxes can be populated dynamically via XPath expression. Use the same XPath expression to define the values that the end user sees as well as their associated XML values or use different XPath expressions to identify discrete values. If you use different XPath expressions the values the end user sees and their XML values are automatically mapped to one another. In the example below, the end user is prompted to select the group to which he is currently assigned (one, two, three or four). However the group number (not the name) will populate the database. Please note that the values the end user sees could be sorted in alphabetical (or numerical) order if the Sort Values in Authentic box were to be checked. The XPath expressions above produce the output below – the end user selects “Two” but a numeric value is saved to the XML document. The combo box – particularly one that supports the differentiation of values visible to the end user and those that actually populate the database or file – is an invaluable resource in the design of electronic forms. StyleVision automatically generates the stylesheet for an electronic form along with those for HTML, PDF, Word 20007+ and RTF from your template. The Authentic eForm provides an interface for end users to enter and edit XML or database data and is viewable in Authentic View, Altova’s free graphical XML document editor. Have you used enhanced combo box functionality to solve a data entry or population issue? Share it with our active community of StyleVision users by posting to our Facebook wall, commenting here on our blog or joining a discussion in our User Forum on our Website!

Tags: , ,

Advanced Presentation and Formatting in StyleVision


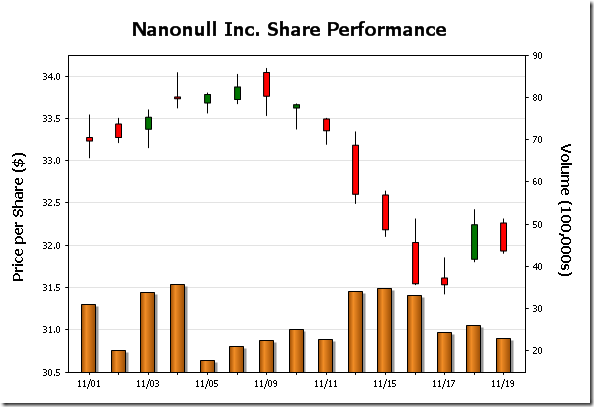
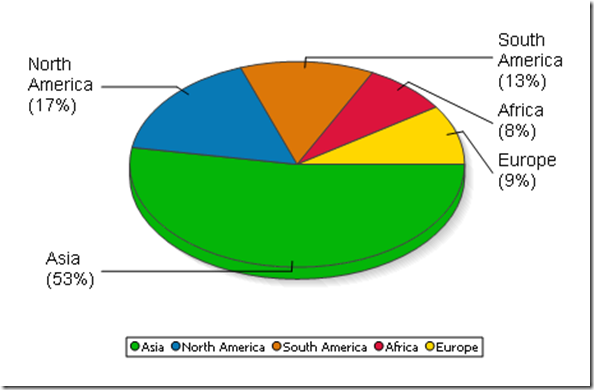
The StyleVision stylesheet and report design tool has added a plethora of advanced functionality over the past several releases. In this post we’ll explore some of the advanced presentation and formatting capabilities that make this tool so powerful. Data visualization (e.g., charts and graphs) and other graphical elements are de rigueur these days. Whether it’s showing change over time via a simple bar graph, highlighting performance with an image from the art department, presenting market data with a candlestick chart or developing a gauge for dashboard reporting, organizations today demand the ability to include sophisticated graphics on all sorts of output – including Web sites. Altova StyleVision 2011r2 can help you meet these demands with advanced presentation and formatting capabilities. You can use StyleVision to generate graphical representations of XML, database, and XBRL data for output to eForms, PDF, HTML, RTF, and Word 2007+. Advanced formatting capabilities will enable you to create impressive charts, graphs and other data views that resonate with audiences. In addition to 2D and 3D bar and pie charts, you can create line, area, candlestick, and gauge charts for use on Web sites or printed materials. Overlay reports provide you with the ability to juxtapose two data sets such as opening, high, low, and closing share prices (candlestick chart) with daily share volume (bar chart) as pictured here. Create Overlay Reports with StyleVision Comprehensive style attributes including colors, background images, legends, and even dynamic XPath settings provide you with complete control over how XML, database, and XBRL data are presented. Among pie chart attributes StyleVision users can select from, for example, are start angle, drop shadow, tilt (for 3D), color scheme (including user defined), and visibility of values, percentages, labels and legends. Create Advanced Pie Charts with StyleVision Adding background color and images is easy with drop down boxes – to achieve the yellow vertical gradient pictured in the overlay chart below simply go to All Settings under Appearance in the Chart Configuration dialog box, select Background Color in the Plot section of the General tab and select vertical gradient and the yellow color swatch from the drop down boxes.Advanced Charting with StyleVision StyleVision even offers users the ability to design templates so that output can be modified dynamically based on end user input. Below is an eForm that presents information in English and German depending on which button is toggled – conditional statements associated with a variable declared at the $XML template control this. Please note that the formatting in the Date field changes as well. Design Forms in Multiple Languages with StyleVision Design Forms in Multiple Languages with StyleVision Keep in mind that any form that you would like to reproduce in StyleVision can be imported as a “blueprint,” a configurable image that serves as a template. This allows the designer to place text, input fields, and other design elements directly on the template and makes it easy to build an eForm identical to the original. With advanced presentation and formatting for charts and graphs Altova significantly extends the capabilities of StyleVision’s already powerful report builder – your designs are limited only by your imagination. clip_image008 We’d love to hear how you are using these or other capabilities in developing your own projects. Please share your stories by posting to our Facebook wall or commenting here on our blog! If you haven’t tried StyleVision before, now is the time. Download a free, fully functional, 30-day trial from the Altova Web site now.

Tags: , , ,

Now Generate Barcodes in StyleVision


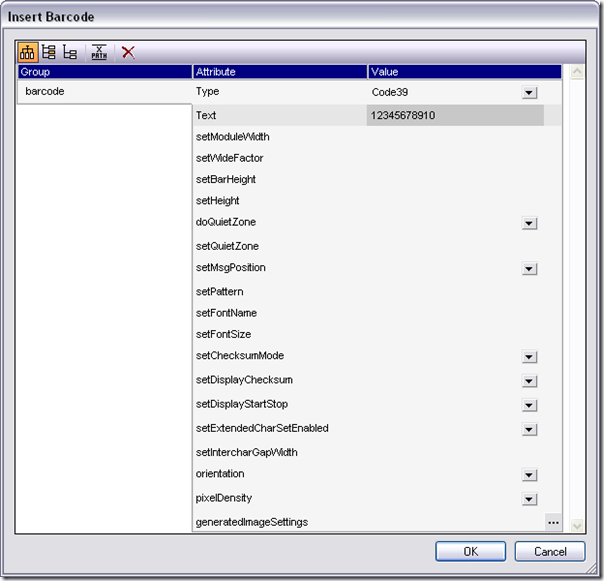
We’re listening.Altova clients have been asking us when they would be able to include barcodes in their StyleVision templates and now they can! StyleVision 2011r2 users can generate barcodes with a single click and insert them into an SPS template for use in eForms, as well as HTML, RTF, PDF, and Word 2007+ output. This brings even more advanced functionality to stylesheet and report design for XML, database, and XBRL data in this unique tool. Simply click on Insert Barcode from the Insert menu, define the type from the Barcode4J library and add the value used to generate the pattern (“text”). generate barcodes with StyleVisionCode 39 barcode generated by StyleVisionStyleVision gives users complete control over the presentation and appearance of barcodes – other properties that can be controlled via the dialog box include size, alignment, colors and borders. StyleVision barcode generatorYou can even use an XPath expression to assign a barcode to a property value.Altova is really excited about providing our clients with the ability to include barcodes in StyleVision-generated output. From larger companies supporting enterprise systems to smaller organizations looking to facilitate electronic data exchange without the use of middleware, StyleVision supports the goals of a broad range of users.Please note that a Java Runtime Environment 1.4 or later (32-bit or 64-bit as appropriate) must be installed to support this feature.

Tags: ,

Using Charts to Effectively Communicate Data


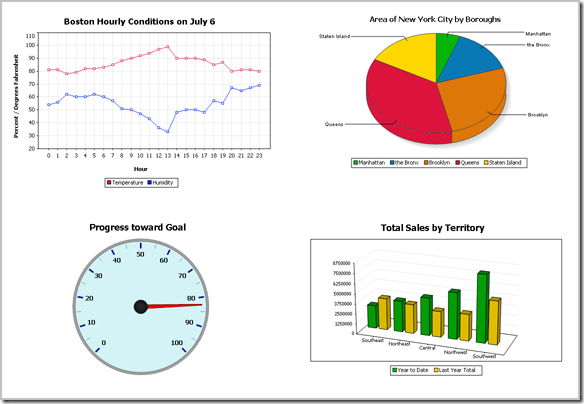
Altova first added support for charts and reporting the Altova MissionKit with the launch of Version 2011 last September. The v2011 reporting functionality includes options for line charts, 2D and 3D bar charts, 2D and 3D pie charts, round gauge and bar gauge charts. Here are a few examples: Charts created with the Altova MissionKit v2011
Advanced chart features in v2011r2

Version 2011 Release 2 of the Altova MissionKit, introduced on February 16, adds an exciting group of enhancements to the chart and reporting features in XMLSpy, StyleVision, and DatabaseSpy. The chart design options and user interface work the same way in all three applications, so MissionKit users can work intuitively and productively as they move from processing XML data in XMLSpy, to preparing charts for a business intelligence report with StyleVision, and even when they create graphical displays directly from SQL query results in DatabaseSpy. The wide range of new customizable charting features introduced in version 2011 release 2 includes:

  • Stacked Bar charts
  • Area charts
  • Stacked Area charts
  • Candlestick charts
  • Chart overlays
  • Background images and color gradients
  • Ability to change position of axis labels
  • And more!

Now you can create attractive and informative charts to represent a wide variety of data sets without exporting data to a dedicated charting application. Charts created using the Altova MissionKit are not limited to any specific presentation technology – for instance you can use StyleVision to include charts in HTML, Microsoft Word, RTF, or PDF documents, or you can save charts created in DatabaseSpy in a variety of image formats at the custom resolution you specify. In this post we will show some examples of the new charts and features available in all three MissionKit reporting and charting applications – XMLSpy, StyleVision, and DatabaseSpy.

Stacked bar charts

Stacked bar charts are a variation on bar chart presentation and are especially useful when multiple ranges of data need to be illustrated. Stacked bar charts are also useful to more clearly illustrate data in a smaller area. The image below shows a stacked bar chart to illustrate the performance of a sales team by region over two years Stacked bar chart Note that the combined height of each stack in the Stacked Bar Chart represents the total sales over the two-year period for each Territory, since the sales for Last Year are added above the Year To Date numbers. Stacked bar charts complement regular bar charts and 3-D bar charts to offer users the greatest flexibility in illustrating SQL query results. If the user prefers horizontal bars, a checkbox labeled Draw X and Y exchanged in the Change Appearance tab selects that orientation. Chart orientation option Horiztonal stacked bar chart This orientation option is also available for other 2-D bar charts, line charts, area charts, and candlestick charts.
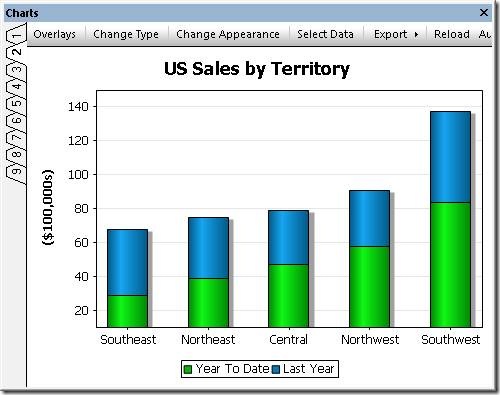
Area charts

Area charts are similar to line charts, with shading applied to make a more graphically appealing display. The area chart below shows a record of temperature and humidity changes by hour over the course of one day. Creative application of color can emphasize the point! Area chart To successfully build an area chart, the analyst must consider the values in each data category. As the area chart is constructed, each category forms an opaque layer on top of the layers for data retrieved previously. In the case illustrated above, Temperature was always a larger number than Humidity, so a SQL query was constructed in DatabaseSpy to retrieve the Temperature value before Humidity to prevent Temperature from acting like a curtain to hide the Humidity data. However, if the data columns appear in a sequence with values in increasing order, the last layer would overlap and hide all the preceding layers. In that case, the chart tab heading titled Select Data lets the user add and delete columns from the results to re-sequence the data correctly. The Select Data column also lets the user edit the names assigned to each column on the X-axis label. Select Data dialog As alternative solution, the Transparency option in the Change Appearance tab lets the user adjust color levels to allow hidden layers to show through.
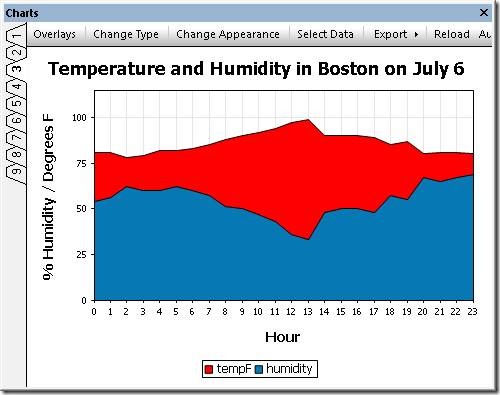
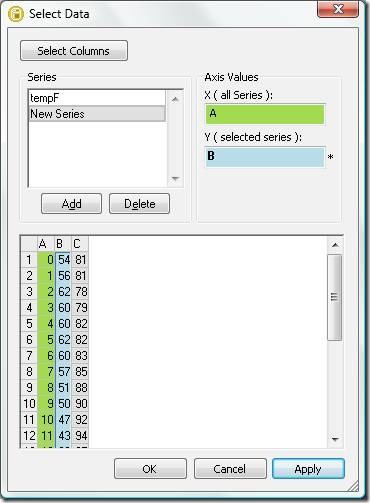
Transparency dialog

Stacked area charts

As implied by their name, Stacked Area charts layer the columns of a data set to illustrate the overall sum of a data series. Stacked Area charts also eliminate the potential overlapping data problem that can occur with regular area charts. The chart below shows a table of air passenger revenue miles traveled by month, with individual regions for domestic and international travel. Stacked area chart The Stacked Area chart creates a graphical representation of the total of Domestic and International miles, even though the total miles value was not part of the provided data. This is apparent at the top of the January entry, where the International region intersects the Y axis just below 600 (the original data showed 392 million Domestic miles and 181 million International miles, for a total of 573). A strategic data analyst will always consider the nature of the data to be reported when choosing any particular chart type. For instance in the weather example we used above, adding temperature and humidity values in a stacked bar chart would not be logical!
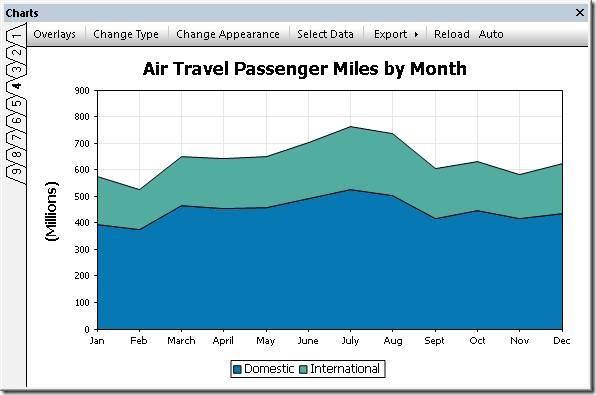
Candlestick charts

Candlestick charts were originally developed by a wealthy Japanese businessman who began trading at the local rice exchange around the year 1750. He kept records of the local market psychology, learning to boost his profits by carefully monitoring prices and not rushing into trades. Today, charts are used to represent financial data such as stock prices over a period of time. Every day the market is open, each stock has four relevant data points that can be rendered in a candlestick chart: the price at market opening, the price when the market closed, the high price during the day, and the low price during the day. Investors and financial analysts like to view these indicators to gauge the stock’s performance over a period of time. In the candlestick chart below, each solid bar represents the range between the opening and closing price and the thin vertical line through each bar shows the extent of the high and low prices for the day. Candlestick chart In this version of the chart, following common convention, the color of each bar signals whether the stock was up or down for the day. If the bar is green, the stock was up for the day– it opened at the price indicated by the bottom of the bar and closed at the price indicated by the top. If the stock was down for the day, the bar is red and the symbolism is reversed – the stock opened at the price indicated at the top of the bar and closed at the price shown by the bottom. Numerous options are available to set line and fill colors, the Y-axis range and values, and more. Because they were intended to be printed in black and white, the original candlestick charts used empty bars to indicate the price increased and solid bars to indicate price decreases. The Altova MissionKit offers this option: Candlestick chart in black and white Another candlestick chart variation omits the opening price and simply illustrates the range by a vertical line and the closing price by a horizontal line. This option is automatically supported when a data set only includes the high, low, and closing prices. Candlestick chart without opening price
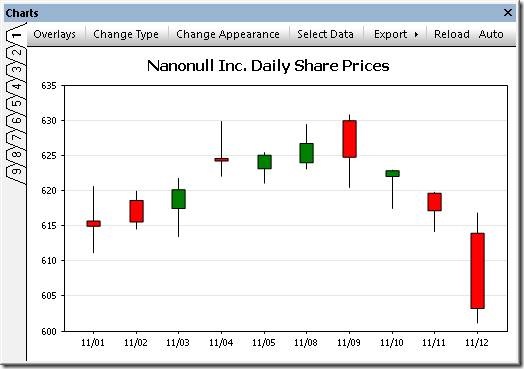
Chart overlays

The Overlays feature lets you combine multiple charts in a single image. Each overlay chart has unique settings and can even be generated from a separate data file. The image below shows a candlestick chart of a stock’s daily prices with the daily sales volume in a bar chart overlay. Candlestick chart with bar chart overlay

Support for background images & color gradients

The ability to specify background color gradients and background images gives you even more flexibility for creating customized, eye-catching charts. Overlaying one chart on another lets you visualize multiple data sets with different Y-axes and types. Area chart with a background image The Change Appearance dialog lets users select a background image, as in the Winter Games chart above, or apply a background color gradient, as in the Summer 2010 chart below. Change Appearance dialog Bar chart with a line chart overlay and background color gradient If you’d like to see for yourself how easy it is to use Altova tools to create attractive charts from XML and database data, download a free trial of the Altova MissionKit.
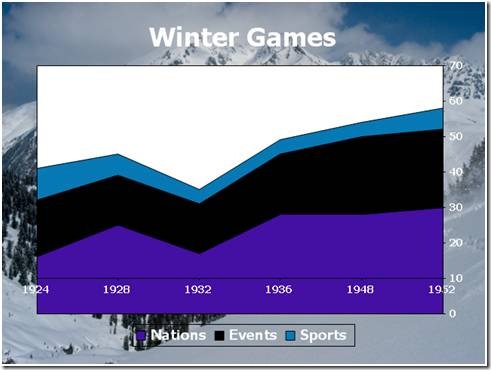
Tags: , , , , , , ,

What Do Industry Authors Have to Say About Altova?


Authors of various industry reference books ranging from SOA and Web services to XML continue to use and recommended Altova tools. The latest update to the Cold Fusion book series – “ColdFusion 9 Developer Tutorial” is an update to John Farrar’s “ColdFusion 8 Developer Tutorial”. In this latest update, Farrar uses the Altova MissionKit, our suite of XML, database, and UML tools to do all his XML work for the book. According to Farrar, “I have a suite of tools from Altova and find they do what I want. I can create XPath, XML Schemas, and more from their tools and don’t ever feel the need to look for a new tool.” ColdFusion9_Farrar Farrar, a ColdFusion expert, teaches the basics of ColdFusion programming, application architecture, and object reuse. He then shows off a range of topics including AJAX library integration, RESTful Web Services, PDF creation and manipulation, and dynamically generated presentation files. So whether you need an overview of XML technologies, the latest information on working with ColdFusion, or want to delve into Web services, you’ll want to check out the Altova Reference Books page on our Web site.

Tags: , , , , , , , , , , , ,

New StyleVision Training


We are excited to announce the latest updates to our StyleVision online training course, which will help you easily come up to speed on the new reporting and chart creation functionality added in Version 2011, as well as how to create a StyleVision design (.SPS) based on an existing XSLT stylesheet. The final chapter in the course covers scripting, another advanced feature added in v2011. Access this chapter to learn how the scripting and toolbar editor helps you add flexibility and interactivity to the Authentic eForms you design in StyleVision. After an overview of the scripting capabilities, you’ll practice inserting macros, adding custom toolbar buttons and event handlers, and adding forms to your design. stylevision-training Like all Altova Online Training courses, the StyleVision modules are available on demand and are completely free. If you’re not a StyleVision or MissionKit customer, you can download a fully functional free trial before starting the training. We rely on your feedback and suggestions to update our online training classes and deliver the content you need most for your day-to-day work. Please let us know what you think of the new StyleVision chapters!

Tags: , , , , ,

StyleVision® & Multi-channel Publishing (yup, we've got that covered too)


Ah, StyleVision… it really is so many different things packed into one powerful application. Stylesheet designer, report builder, eForms designer, and multi-channel publisher, with additional supporting features like charting, Authentic® scripting, and XBRL reporting – it sometimes seems like it does everything short of Vulcanian mind-melds (coming in SD 7411.4). But, for the here and now, let’s focus on multi-channel publishing. Multi-channel publishing is the ability to use a single source of information to provide enterprise content that can be formatted for delivery to different channels like Web, intranet, and traditional print. This methodology can be easily integrated into existing publishing technologies and workflows to maintain overall production value without disrupting the flow of day to day business processes. StyleVision even expands on its multi-channel publishing support with the ability to base publishing templates on multiple disparate data formats including XML, DTD, XBRL, and database source(s). This means that your templates can integrate data from multiple XML sources, or even combine data from an XML Schema and a relational database. In fact, you can even create designs to publish XML documents stored inside relational database columns (currently supported for IBM DB2 and SQL Server only). Multiple Output Formats The StyleVision design interface lets you visually create templates for multi-channel output in HTML, RTF, PDF, Word 2007+, and Authentic® eForms. Using drag-and-drop and advanced entry helper windows, you can easily create an attractive and functional template design for distribution to virtually any modern publishing medium.

clip_image001

StyleVision autogenerates standards-conformant XSLT 1.0/2.0 and XSL:FO stylesheets based on your template design to instantaneously publish your source content into the target output format of your choice. Simply click on the relevant output tab on the design pane to render your data at any time. You can even view or save the generated transformation code.

clip_image003

Building Business Reports To create a multi-channel publishing template in StyleVision, simply open an existing XML Schema, XML instance, DTD, XBRL taxonomy, or database, and the content model will appear in the Schema Tree entry helper. You can even connect to multiple XML and database schemas to incorporate data from multiple sources – such as an XML file and a database – in your design. When you select an element or attribute that you wish to see in your report and drag it from the Schema Tree window onto the design pane, StyleVision prompts you to specify how you would like the new node to be handled (for example, as a new paragraph, image, table, etc.). This information will be rendered dynamically based on the data in your source(s). You can also insert static content such as header text, images, hyperlinks, and so on. clip_image004 StyleVision also offers an alternative design paradigm for those more accustomed to working with common desktop publishing applications. For more information, see the Electronic Forms Design page. The StyleVision interface provides advanced entry helper windows for viewing, editing, and assigning the style and layout properties of each element or document section in your report design. Learn more about this functionality on the Stylesheet Designer page. To meet the specific rendering requirements of XBRL financial reports, StyleVision includes an easy to use XBRL Table Wizard. Learn more about this feature on the XBRL Rendering page. Conditional Templates Conditional templates add to StyleVision’s multi-channel publishing capabilities, enabling you to apply advanced dynamic functionality to your design. Conditional templates are based on XPath expressions and allow you to design forms with layout and presentation that changes based on source data in the XML file(s) or database. Advanced publishing protocols like output-based conditions enable you to display multi-channel content differently depending on its delivery format. Conditions for specific output can be placed around individual parts or components of the document, thus providing considerable flexibility in the way the different output documents are structured. For example, HTML output may require functionality like hyperlinks or special instructions that are not necessary for print output. Content Editing StyleVision designers can also easily create and distribute electronic forms for editing using Authentic, Altova’s low cost XML and database content editor. Together, these two applications provide an easy-to-use and powerful content editing framework that lets developers create a robust data entry application that can publish output to multiple channels. For more information, see the Authentic Forms Design section. Functions Multi-channel publishing templates designed in StyleVision support advanced functionality such as auto-calculations, business logic validation, and much more. Read more about advanced stylesheet functions. Charts & Graphs StyleVision also supports creating detailed multi-channel documentation with visual representations such as charts and graphs. As with all StyleVision designs, charts can be rendered for multi-channel output in HTML, RTF, PDF, Word 2007+, and as electronic forms. For more information, see the Charts & Graphs feature page. Check out StyleVision and add true flexibility to your business documentation with powerful support for multi-channel publishing. Download a free 30-day trial of today!

Tags: ,

New Feature : Authentic® Scripting in StyleVision®


StyleVision has really benefited from some very cool new features in our past and current releases – absolute positioning, editable variables in eForms, global templates, and of course, charting, bring power and flexibility to your report generation and electronic forms designs. Now with our 2011 release, the addition of an integrated scripting environment expands on these features, giving you the ability to create robust data entry applications for Authentic users. Scripting functionality is embedded directly into the StyleVision design (SPS) so that Authentic end-users only need to open an eForm to start updating XML and database sources. Event handler and macro components can be written using supported scripting languages, JavaScript or VBScript, and you can also design input forms graphically using drag and drop functionality. To embed scripting functionality in a StyleVision design (SPS), open the Scripting Editor window via the Authentic | Edit Authentic Scripts menu command or by choosing Authentic Script from the Design tab context menu. stylevision_script The Scripting Editor provides an interface through which you can create any of the following four main components:

  • Global declarations – scripts that contain variables and functions that can be used by forms, event handlers, and macros.
  • Macros – scripts that are used to assign user-defined actions to design elements, toolbar buttons or context menu items.
  • Event handlers – scripts that can be associated with a variety of available events (OnSave, OnValidate, etc.) for user interface elements in an Authentic form. The return value from the script typically instructs the application how to continue its processing.
  • Forms – simple graphical components made up of text input fields, buttons, and so on. Forms are used to show dialogs or request additional user input within scripts that are used as event handlers and macros.

Global Declarations The GlobalDeclarations component is presented by default in every scripting project. Variables and functions are added using code fragments written in the scripting language (JScript or VBScript) associated with your project. An example function, StartChangingAddress, appears below: script1 Variables or functions created in the global declarations script are accessible to all forms, event handlers, and macros in your scripting project. Macros Macros let you create functions that are called from other scripts or event handlers. For example, the macro shown below uses the GlobalDeclarations, including the StartChangingAddress function, to create a form for adding information to an active XML document. script2 Macros can be specified and associated with StyleVision design elements using the Authentic group in the Properties window. Object events that are supported for macros are:

  • OnBeforeChange
  • OnAfterChange
  • OnBeforeLinkClick
  • OnClick
  • OnSetFocus
  • OnKillFocus

clip_image003 Macros are controlled in the right-click menu of the scripting project tree, where you can add or rename. clip_image004 Event Handlers Event handlers can also be defined by selecting the Events icon in the toolbar of the Properties and Events pane. Here, you can define the behavior that the application should exhibit once a specific action is initiated or completed. Events that can be controlled include mouse movement and clicks, drag and drop, key presses, and more. Authentic View event scripts added in Version 2011 include:

  • On_AuthenticLoad – allows Authentic to set up features before the user starts working with the file
  • On_AuthenticBeforeSave – lets you prevent saving if, for example, entered data is not complete
  • On_AuthenticToolbarButtonClicked – allows behavior to be extended/modified on toolbar click
  • On_AuthenticUserAddedXMLNode – lets Authentic load any child nodes or textual content to the newly added XML node, if necessary, so that the form is prefilled with data

The scripting editor provides a folder which contains the full set of events for which event handler scripts can be written. clip_image005 Forms The Authentic Scripting Editor lets you graphically build forms using a palette of objects such as text input fields, buttons, labels, and more. General form properties such as size, background color, font styles, etc. are defined in the Properties pane. clip_image006 The form object palette provides all of the objects that are available. Registered ActiveX controls can also be added by selecting the Add ActiveX Control command in the right-click menu. clip_image007 Once an object has been inserted in your design, you can specify its appearance properties – such as alignment, borders, scroll bars, etc. – in the Properties pane.

Scripting in Practice

Authentic View scripting gives StyleVision designers complete and flexible control over various aspects of the user interface. In addition, extensions to the existing COM APIs add more flexibility for scripting and interactive eForm design. For example: Interactive object-specific design elements – such as the click of a button, modification of form elements, focus change between fields, etc. – can be accessed through the Authentic interface. User actions include OnClick, OnBeforeLinkClick, OnBeforeChange, OnAfterChange, OnSetFocus, and OnKillFocus. clip_image008 Entry helper windows can be suppressed to ensure that Authentic end-user access is limited only to modification of the intended elements, attributes, and entities. Context (right-click) menus can be completely customized by removing existing or adding new commands. clip_image009 New toolbar buttons can be created and associated with macros, giving the designer the ability to add completely new commands to the toolbar. clip_image010 Custom and standard toolbars can be modified by disabling any buttons that the end-user should not have access to. clip_image011 The COM API has also been extended with new interfaces and additional methods and properties including:

  • AuthenticView (i.e. CreateXMLNode, EvaluateXPath, GetToolbarButtonState)
  • AuthenticRange (i.e. IsSelected, GetVariableValue)
  • XMLData (i.e. GetChildElement, InsertChildAfter)
  • AuthenticEventContext (i.e. GetXMLNode, SetVariableValue)
  • AuthenticContextMenu (i.e. CountItems, DeleteItem, GetItemText)

Check out all of this new functionality and more – download a free 30-day trial of StyleVision today!

Tags: , , ,

MissionKit 2011 Now Available in Japanese


With the release of Version 2011 we are thrilled to bring you the Altova MissionKit in Japanese. Now all the Altova tools available in the MissionKit have been fully translated into Japanese. Like the English and German versions of the tool suite, the fully translated Japanese language version provides users with powerful functionality for XML and Web development, data mapping and integration, rendering and publishing of XML, XBRL, and database data, UML modeling, and more. All the tools available in the new Japanese language version of The MissionKit are available at the same cost as the English versions, and current Version 2011 users can now unlock any language version using their existing key code. missionkit_jp If you haven’t checked out our latest release – Version 2011, download a free, 30-day trial today! The Japanese language version of all the MissionKit tools can be purchased from the Altova Online Shop or through your preferred reseller.

Tags: , , , , , , , , , , ,

New Software Release : MapForce 2011


  clip_image002 On September 8, Altova released v2011 of the MissionKit with powerful new features across the entire product line. MapForce has benefitted from the addition of advanced data integration functionality like chained transformations, integration with StyleVision for rendering transformation output, new formatting functions, and extended support for the UN/EDIFACT and ANSI X12 EDI formats. Let’s take a closer look at the exciting new features in MapForce 2011 including:

  • Chained transformations
  • Integration with StyleVision for output components
  • Formatting of numbers, dates, and times
  • Extended support for EDIFACT
  • Extended support for X12

Chained transformations Support for chained transformations lets you create complex mappings where the output of one mapping becomes the input of another. This is a powerful feature that adds to MapForce’s ability to execute fully automated transformations. Each chained component becomes a modular entity in an interdependent transformation sequence, allowing for conversions to be made on-the-fly. You can create chained transformations using any number of mapping components connected to a final target component. Preview and code generation features can be displayed/generated for intermediate components, as well as for the final mapping result. Intermediate mapping components also now have a "pass-through" button in the title bar that lets you define the set of data that gets passed on to the following component.  

clip_image003

For example, the mapping above shows a chained mapping where the pass-through button is active and sample data is assigned to component A. The output preview offers two separate sets of data: XML that conforms to the Contacts.xsd schema and incorporates a subset of data mapped from the Employees.xml sample file, and XML that conforms to PersonList.xsd using data from the Employees sample file. In both cases, the data has been amended with the relevant constants and functions that are shown in the MapForce design pane.   clip_image004 Integration with StyleVision for output components Support for Global Resources throughout the MissionKit has already offered you some integration between Altova software applications… But this feature takes that integration to a whole new level, allowing you to render XML and XBRL output from your data mappings into HTML, RTF, PDF, and Word 2007+ using an associated StyleVision template design. This essentially combines MapForce’s any-to-any data mapping capabilities with a sophisticated rendering engine, meaning that you can now automate report generation from virtually any data format that can be mapped to an XML Schema or XBRL taxonomy. In the example below, a StyleVision design has been associated with the mapping by simply right-clicking the output file and browsing to select a suitable SPS file using the Component Settings dialog.   clip_image005   Once the SPS file is entered or selected, you will be able to simply click on the relevant format tab (i.e., HTML, RTF, PDF, or Word 2007+) to view rendered data.   mapforce-html Formatting of numbers, dates, and times Probably one of the most requested features, this lets you easily convert numbers, dates, and times to their string representations using several different formatting functions. For example, the simple format-number function below converts a numerical input (e.g., 12345) to a monetary one in with a USD prefix, comma separating the thousands digits, and two decimal places (e.g., $12,345.00).   format-number   This post really just scrapes the surface of what the new MapForce release has to offer -download a free 30-day trial of Mapforce today to experience all of these new features and more!

Tags: , , , , , ,

New Software Release : StyleVision 2011


On September 8, Altova released v2011 of the MissionKit with the addition of powerful reporting functionality across many of the products. Specifically, StyleVision has been supercharged with a multitude of new features, securing its place as an advanced and versatile business intelligence application, priced for today’s market. Let’s take a closer look at the exciting new features in StyleVision 2011 including:

  • Charts as a new design element
  • Chart wizard for XBRL files
  • Explicit support for HTML/CALS tables
  • Ability to import existing XSLT files
  • Scripting & toolbar editor for Authentic®

Charts as a new design element StyleVision joins other MissionKit 2011 tools with support for charting, adding to its already advanced general purpose reporting capabilities to create a highly scalable decision support tool for XML, database, and XBRL content. As with all StyleVision designs, charts can be easily rendered for multi-channel output in HTML, RTF, PDF, Word 2007+, and electronic forms. The following types of charts are available:

  • 2D & 3D pie charts
  • 2D & 3D bar charts
  • Category line graphs
  • Value line graphs
  • Gauge charts

The chart configuration dialog lets you use XPath to select data for your charts. This can be as simple or as complex as you want, running the gamut from database data that is already laid out in a tabular format to XML files where the nodes you need to select are spread out over hundreds of lines of code. Pssst… if you’re thinking that this would be great for the unique demands of XBRL, read on because we created something special with that in mind ;). Here are a couple of examples of charts that you can build in StyleVision: clip_image001 clip_image003 Yup, you can even chart completely different sets of data on the same graph. How creative you want to get with your visual analysis reports is really up to you. You can even create interactive charts for use with Authentic – allowing end users to manipulate eForms to view the desired result. For example, the screenshot below shows the Authentic view of a pie chart where a drop-down menu (combo box) selection dictates the subset of data that is represented. clip_image005 Charts are easily integrated into your StyleVision report templates at any point by simply dragging the relevant node onto the design pane and choosing Insert Chart from the context menu. The Chart Configuration dialog can then be used for chart settings (choosing chart type and style) and data selection (populating your chart axes with the relevant data from the source). clip_image007 You can even use Dynamic XPath Settings to apply transactional data to your chart. Of course, if you sometimes have trouble telling your .s from your /s, you can always get some help with more complex expressions from StyleVision’s XPath Builder. Chart wizard for XBRL files If you are familiar with XBRL, you are intimately aware of the complexities associated with navigating XBRL taxonomies. And, if you’re impressed with what you’ve just read about StyleVision’s charting capabilities, you are probably trying to remember where you put that old XPath reference guide. Not to worry! StyleVision has added to its XBRL rendering support with an XBRL Chart Wizard that lets you easily select data and define presentation settings for your XBRL reports. clip_image009 Concept and Period Properties dialogs are included to let you specify which elements should be included and how periods (instants or intervals of time) should be handled in your chart. Explicit support for HTML/CALS tables StyleVision now provides direct support for HTML/CALS tables, meaning that it will automatically recognize values dictating table structure (column number, row height, etc.) and apply them to rendered output. (v2011 adds support for rendering HTML/CALS tables in HTML, RTF, PDF, AND Word 2007+ – previous releases have supported output to Authentic eForms.) clip_image011 You can also easily assign additional presentation styles to HTML/CALS tables using the Edit CALS/HTML dialog. clip_image013 Ability to import existing XSLT files Well, I’m sure a few of you were hoping that this one was coming soon… You can now base your StyleVision template designs on existing XSLT files that were designed for HTML output or XSLT files with XSL:FO commands that were designed for output to PDF. Simply choose the New from XSLT File option and presto change-o, your design will be fully manifested in the design pane. Now you can edit your template using StyleVision’s graphical interface and output to even more formats (HTML, RTF, PDF, Word 2007+, and Authentic eForms) with just the click of a button. Scripting & toolbar editor for Authentic This feature is just way too cool not to devote an entire post to it, so keep your eyes peeled for a full description coming up on this blog. In the meantime, check out the Authentic scripting page for a brief description and examples. Better yet, just download a free 30-day trial of StyleVision today to test drive all of these new features for yourself!

Tags: , , , , , , ,

Working with XML in Databases


More and more users are storing XML documents in database columns, especially when XML data is sent or received from other entities. Storing data in XML helps enterprises more easily accommodate revisions to industry-standard data formats as XML Schemas evolve over time. One challenge in migrating from a relational database to an XML-oriented database application is developing queries that replace traditional SQL queries of relational data to parse XML documents stored in the database. We recently had an opportunity to address XQuery for XML in databases in a presentation titled Altova Tools for DB2® in a teleconference sponsored by IBM® for the pureXML™ Devotees user group. After an introduction and brief background on Altova, we focused on the special functionality included in XMLSpy to manage XML Schemas in DB2 and to edit XML data stored in DB2. The XMLSpy Database Query Window makes it easy to edit XML database content directly in XMLSpy. XMLSpy_editDB2_blog Altova has built specialized capabilities for deep integration of Altova tools with the DB2 pureXML data server to help customers working with XML, XML Schema, XQuery, and other XML-related technologies. We demonstrated the XMLSpy XQuery editor, XQuery debugger and XQuery profiler, with support for executing XQuery scripts directly against the DB2 database and for the special DB2 xmlcolumn and sqlquery operators. We closed the presentation with a walk-through of the steps a user can take to migrate legacy relational data to an XML-based application, including inferring an XML Schema from relational data in a table in DB2, then importing data from the table and automatically tagging it in XML according to the new XML Schema. We have uploaded a PDF file the slides from the presentation on SlideShare. You can also get a copy at the IBM pureXML Devotees page, where you can listen to the recorded audio as well. The best way to experience for yourself how well the features of XMLSpy, MapForce, StyleVision, and DatabaseSpy work with DB2 and other databases with XML is to click here to download a free trial of the Altova MissionKit.
Tags: , , , , , , ,

Altova MissionKit Integration with Visual Studio – On with the Show!


VisualStudioWebButton Altova products have long supported tight integration with Visual Studio, giving developers seamless access to the advanced functionality of XMLSpy, MapForce, StyleVision, and UModel directly in their preferred development environment.So naturally, the Altova team is excited to attend the launch of Visual Studio 2010 on April 12-14 at the Bellagio Hotel and Casino in Las Vegas, NV. We’ll be demonstrating all the latest features of the Altova MissionKit 2010 Release 2 and we’d love to meet you at booth 614 on the Exhibition floor.If you’re not headed to Las Vegas, you can read more about Altova Integration with Visual Studio at the IDE Integration page on the https://www.altova.com/. Or follow the links below for detailed information on Visual Studio integration for each tool in the MissionKit:XMLSpy 2010 Professional and Enterprise Editions support seamless integration with Visual Studio , Microsoft’s premier application development environment, where you’ll have access to all of XMLSpy’s tools and utilities for modeling, editing, transforming, and debugging XML technologies.MapForce 2010 Professional and Enterprise Editions support full Visual Studio integration, allowing you to harness the power of MapForce for data integration, Web services implementation, and C++, C#, and Java code generation directly inside Visual Studio.StyleVision 2010 Professional and Enterprise Editions are offered as Visual Studio plugins, meaning that you can easily design and implement stylesheets for simultaneous XML, XBRL, and database output to HTML, RTF, PDF, and Word 2007+ (OOXML) directly within Visual Studio.UModel 2010 Enterprise Edition now supports advanced integration with Visual Studio, including code/model synchronization, giving you access to all of its UML modeling capabilities from within Visual Studio.(Oh yes, we know Visual Studio is not the only tool for all the XML, data integration, and UML developers out there. The Altova MissionKit IDE integration modules also support Eclipse.)

Tags: , , , , , ,

StyleVision Review and Video Demo


As the XML Aficionado reported over on his blog, Dave Gash recently published an in-depth review of Altova StyleVision 2010 on the WritersUA Web site. The review provides an excellent synopsis of how the StyleVision stylesheet and electronic forms design tool works and even covers some of the exciting new features in the recently released 2010 version, including absolute positioning, electronic forms design, blue print support, and more. Gash notes that StyleVision helps take the pain out of creating XSLT stylesheets to render XML or database data:

"In a nutshell, StyleVision generates standards-conformant XSLT and XSL-FO stylesheets based on your design, enabling true single-source, multi-output, dynamic-content publishing. Believe me, that’s a neat trick if you can do it, and StyleVision can."

During the rest of the review, Gash walks through some common tasks (illustrated with screenshots) that users may accomplish using StyleVision and concludes:

"StyleVision is one of the most interesting software applications I’ve seen in years. Without question, it offers a new and unique approach to XSLT transform authoring, a skill formerly reserved for beanie-wearing, pocket-protector using, syntax-obsessing code jockeys such as your humble reviewer. It allows more of the tech pubs workforce than ever to transform raw data into aesthetic, useful pages."

Please check out the StyleVision review for all the details.

UPDATED: StyleVision Demo

To see a brief overview of the features highlighted in the review above, check out our Intro to StyleVision video demo, which has been recently updated to include new functionality in Version 2010. This three-minute video will give you a good idea of what you can accomplish with StyleVision. StyleVision Demo   And when you’re ready to test drive StyleVision for yourself, grab a free trial from our Web site.

Tags: , , , ,

New in StyleVision v2010


Over fifteen new features, and they’re not small ones either, they’re the kind that a Marketing Manager has to write about. Several months ago I was groaning (inwardly, of course) about this. But the v2010 release is out, the StyleVision v2010 feature descriptions are written, and now I am genuinely excited to share with all of you the powerful functionality in the "Most Wanted" release. All of these features, I remind you, were directly requested by our customers either in person at the Altova tradeshow booth, or online via our Support Center or user forums – so please keep them coming! I will briefly outline some of the new functionality in StyleVision v2010 below, and make sure you look out for future posts where we will be highlighting specific features in all of the MissionKit tools in more detail. The best news of all though, is that we’ve just released the updated StyleVision online training that covers many of the new features in v2010. StyleVision is a unique tool for designing stylesheets and building reports based on XML and database data and simultaneously publishing them in HTML, RTF, PDF, Word 2007, and/or Authentic e-Forms. Completely new design paradigm To call this a "feature" simply doesn’t do it justice. The StyleVision user interface has been redesigned to give you an alternative method for how you structure your templates. Current users do not panic, this is just an option and you will still be able to use StyleVision in the way that you have learned to love. The rest of you, however, can now approach StyleVision in the same way you do common desktop applications, adding style first and content afterward. Templates can now be created within layout containers, and an optional blueprint image can be inserted as a design guide. clip_image002 Layout containers can: · Be inserted within document templates or encompass the entire document. · Inherit the dimensions of the document section or have user-defined dimensions. · Be assigned any number of style properties (borders, background color, font, etc.). · Contain a blueprint image to serve as a reference template for the design. True electronic form design through absolute positioning Absolute positioning in StyleVision coupled with the new design paradigm mentioned above lets you easily and precisely design templates for electronic forms. You can insert design elements like lines, boxes, text, etc. by specifying their x and y coordinates in the document section. Take a look at the example below – an I-9 form template based on an imported blueprint image – to see how this works. clip_image004 Support for multiple page layouts in the same document This is an extremely important feature for anyone working with print formats in StyleVision where it is not uncommon to find pages with many different requirements in the same document. For example, you may need to intersperse pages of different sizes, landscape and portrait modes, different headers and/or footers, etc. You can now use document sections to specify different layout properties for your templates. clip_image006 Column formatting for print output formats Another great new feature for print output in StyleVision is the ability to add automatically formatted columns in template designs – columns that flow content from the bottom of one column to the top of the next. clip_image007 Inline HTML, XSLT, XSL:FO processing commands And now let’s delve a little into the more technical new features in StyleVision… You can now insert processing commands at virtually any point in your design templates. This gives you the flexibility to call upon functionality that is not necessarily natively supported in StyleVision. clip_image009 Ability to import external XSLT files StyleVision now also allows you to import external XSLT files as part of their template designs. This adds an xsl:import statement to the StyleVision stylesheet and enables you to add your hard coded XSLT files to styles and other integrated features from the StyleVision design interface. clip_image010 Extension templates based on any XPath StyleVision now also supports the use of XPath wildcards: (*, node(), etc.) and the | operator, for example, can now be used for user-designed templates that can output a wide range of variable data based on the referenced XML source code. This allows for full flexibility in selecting nodes and values from any XML location and in any combination within your document(s). clip_image011 Additional new features in StyleVision v2010 That is a brief list of my favorite new features from the StyleVision v2010 "Most Wanted" release, but we have also included many others such as: · Ability to print design templates · XHTML output option · Disable-output-escaping function · Ability to modify output DPI · Support for variables in design · Native code calls (.NET, Java, JavaScript, etc.) in XPath statements   Download a free trial of StyleVision v2010 – or if you have active SMP, download your upgrade today!
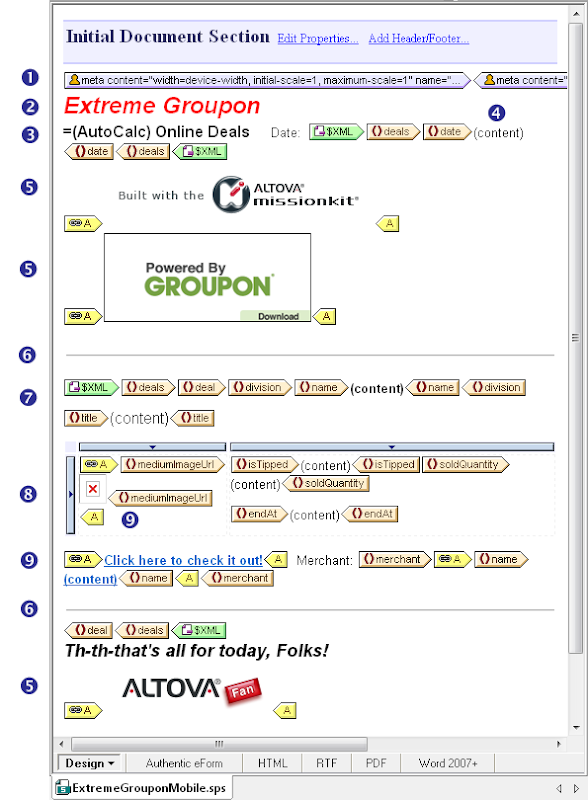
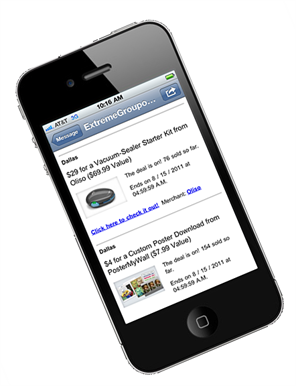
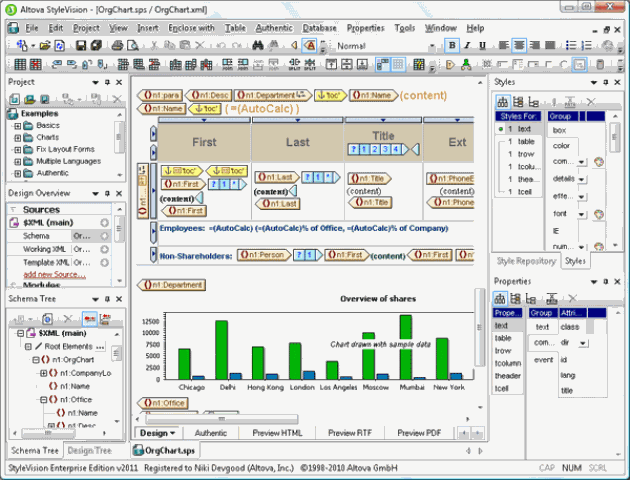
Tags: , , ,

Altova at Microsoft PDC


clip_image001The Altova road trip continues as we head west to Microsoft PDC in Los Angeles from November 17-19 at the Los Angeles Convention Center. If you’ll be attending PDC, make sure to stop by and meet with the Altova team at booth 517. We’ll be demonstrating all the Most Wanted features of Version 2010, our latest software release that includes XBRL enhancements in XMLSpy, support for WSDL 2.0 in XMLSpy and MapForce, a new absolute positioning design paradigm in StyleVision, database schema conversion in DatabaseSpy, and much more. With the new emphasis on software modeling in Microsoft development tools, you’ll want to check out SysML and all the other new functionality in UModel 2010. We love L.A., but if you’re not going to PDC this year, be sure to check the Altova blog again later for updates about the event and more details about Version 2010.

Tags: , , , , , , , , , , ,