Tag Archive for: DatabaseSpy

AI-Ready Database Tool


AI is a great productivity booster for IT projects, and working with databases is one area where AI is really making inroads for improving efficiency. By leveraging AI in database tools, DBAs and database developers of any skill level can save time and effort with AI-generated SQL scripts and sample data, for instance, as well as query optimization and troubleshooting.

Altova offers an integrated AI Assistant in DatabaseSpy to help with SQL script creation, data modeling, SQL and error explanations, and even SQL pretty-printing. This makes the multi-database tool, which supports all major databases in a single UI, even more useful.

Let’s take a look at how it works.

Read more…
Tags: , , ,

XPath & XQuery Tutorial for SQL Pros (Video)


Prior to starting at Altova I had zero experience with both XPath and XQuery. The first task I was presented with was to train myself on both query languages as quickly as possible and produce a concise video that would serve as an XPath tutorial and XQuery tutorial. It was important to develop a thorough understanding of their features and capabilities because both languages are integral to app development in MobileTogether and querying data in XMLSpy. I started with a strong background in SQL, learning XPath and XQuery by building queries first in SQL, and then determining how to replicate them in both query languages.

Read more…

Tags: , , , , ,

SQL Queries with Parameters: Support for SQL Templates in DatabaseSpy


SQL queries with parameters, also known as SQL templates, are a flexible and efficient solution for repetitive data reporting requirements, for instance allowing users to easily execute complex join statements with multiple sets of values. DatabaseSpy, the multi-database query, design, and editing tool from Altova, includes robust support for developing, executing, and refining complex SQL queries with parameters, also known as SQL templates.

Prototyping SQL queries with parameters in DatabaseSpy can even accelerate development of queries required in other projects such as database mappings in MapForce or database data sources for MobileTogether cross-platform mobile apps.

Big Data Support

Read more…

Tags: , ,

Exploring an Unfamiliar Database with DatabaseSpy


Software developers working on a new app, data professionals in a variety of enterprises, and even database administrators often encounter unfamiliar databases and need a database tool to quickly explore tables and relationships.

Altova DatabaseSpy is a unique multi-database query, design, and comparison tool with a graphical database design editor that empowers users exploring an unfamiliar database to quickly visualize tables, relationships, and even datatype definitions that may be unique among database types.

Read more…

Tags: ,

Update to Altova’s Database Tool Adds Important New Features


DatabaseSpy is the unique database tool that supports all major databases and facilitates database query, design, structure comparison, table content editing and comparison, and even generates elegant charts from query results.

The recent update of DatabaseSpy to version 2017 Release 3 adds several new features, including the ability to automatically generate a complete DDL script for any database schema.

Read more…

Tags: , ,

Mastering Paid Keywords


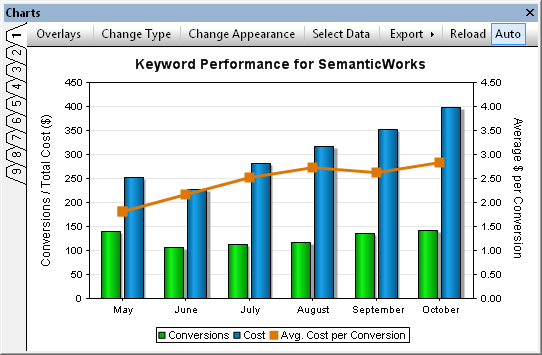
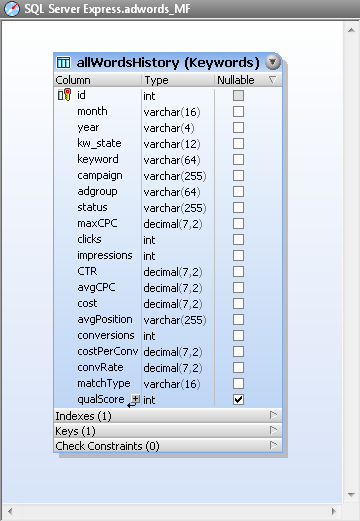
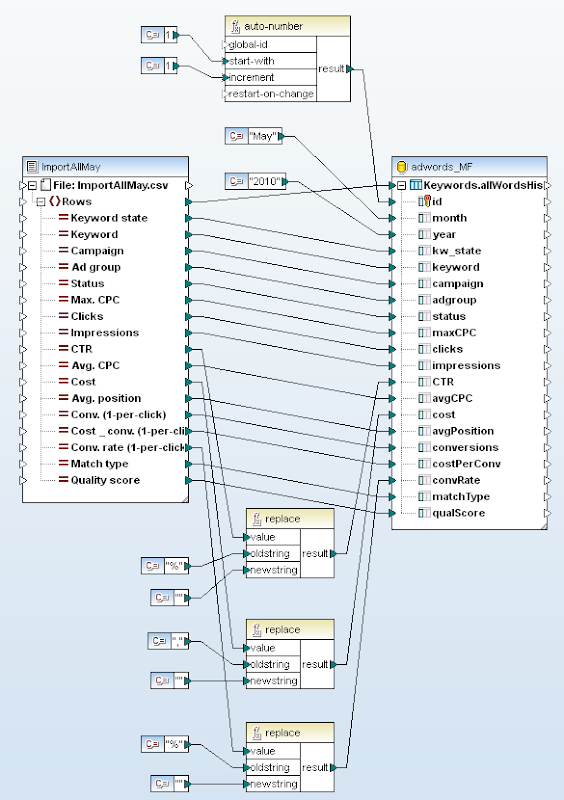
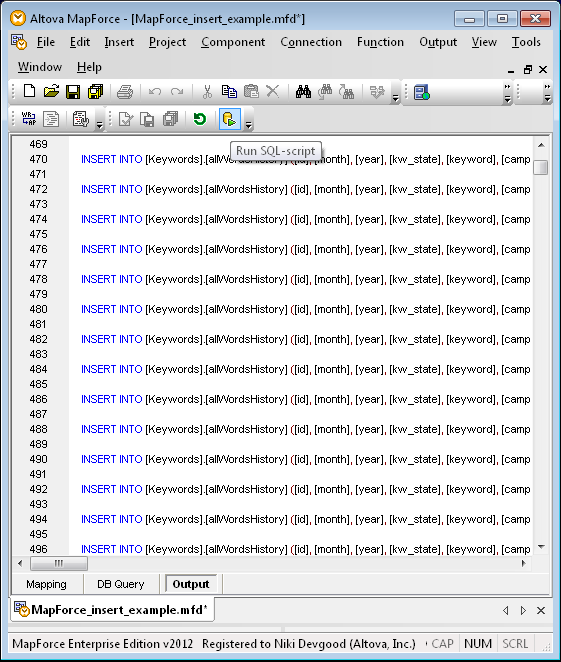
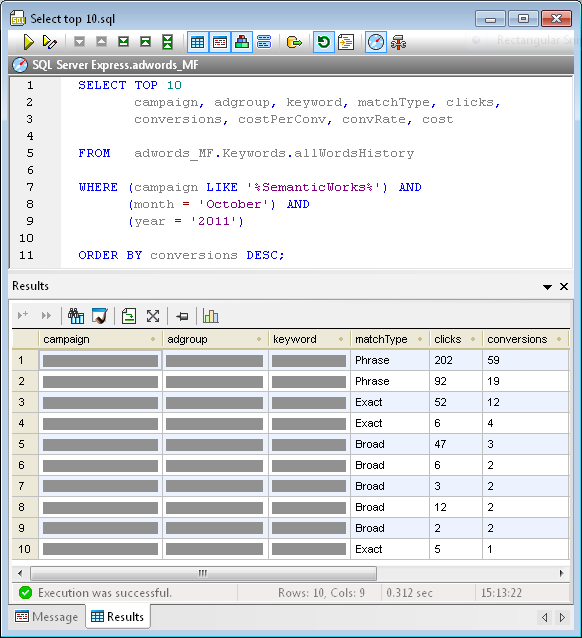
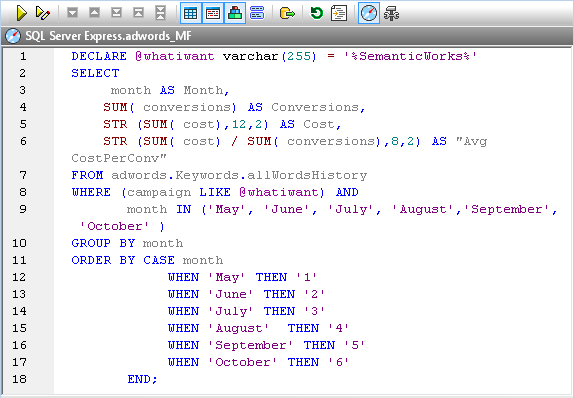
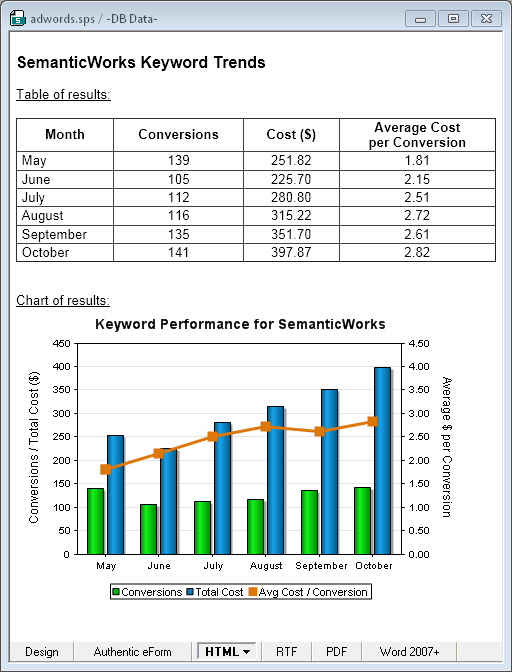
Anyone who manages paid keyword search knows it is hard work! You can look at vast reports of raw statistics and quickly get lost in trivia. At Altova we designed a better way to analyze and manage the performance data for our Google Adwords campaigns. We can creatively query the numbers to: · Quickly aggregate results for subcategories of campaigns, for instance by product, geographical region, or any other grouping · Easily identify trends over time The chart below illustrates these advantages by collecting data for a single Altova product – SemanticWorks – from multiple campaigns over six individual months. Keyword performance chart created with DatabaseSpy Starting Out Like many keyword advertisers, we were viewing statistics in Adwords, downloading CSV files, then spending hours massaging and manipulating the data in spreadsheets to identify and format the information we required. We wanted more immediate and in-depth reporting of keyword performance while retaining full control of the process and managing everything internally. SQL queries of a database of keyword statistics offer a powerful and flexible alternative. In the remainder of this post we explain how the database design, data mapping, and reporting features of the Altova MissionKit can be applied to create an architecture to efficiently track paid keyword performance. Database Design Our choices were to implement a keywords database on an existing database platform already running in the company, an express edition of a commercial database, or an open-source database, since the Altova MissionKit works with SQL Server®, MySQL®, Oracle®, IBM DB2®, PostgreSQL®, Sybase®, and Microsoft® Access®. We chose SQL Server for our database platform. We connected with DatabaseSpy and used the graphical database Design Editor to create the table shown below. DatabaseSpy graphical table design Most columns correspond to fields in a keywords report. In order to store multiple rows for each individual keyword – one row for every month of statistics – the table also includes columns for the month and year. Populating the Table The Google Adwords online interface lets users create reports of keyword statistics of specific date ranges and download them as CSV files. We downloaded individual CSV files containing our performance data for each unique month. We used MapForce to map values from the CSV files to columns in the database table and insert the month and year data for each row. Keyword report mapping in MapForce The string functions at the bottom center of the mapping diagram remove percent signs and commas from fields we want to treat as numerical data. By doing this in the mapping, we don’t have to massage the columns of data in the CSV files before importing them. Since the CSV files for each month all have the same structure, the mapping needs only minor revisions to import each new month’s data: update the constants at the top that define the starting row id, month, and year. MapForce processes the mapping with its built-in execution engine, reading the CSV input and generating SQL INSERT statements for each row of data. MapForce then allows users to execute the entire generated SQL script by clicking a toolbar icon or from a selection in the Output menu: MapForce database insert script Querying the Database Back in DatabaseSpy, we can query the database from the SQL Editor window. This query reports the top ten performing keywords for SemanticWorks in October 2011. For data privacy, some fields in the Results chart are hidden. Results with table To get additional interesting results, the SQL statement can be easily modified. For instance, the ORDER BY line can sort for highest cost, most clicks, or any other characteristic. The WHERE statement combines data from multiple campaigns. The LIKE keyword treats the percent signs around SemanticWorks as wildcard characters to match any campaign with SemanticWorks anywhere in its name. Other queries could add a geographic identifier such as US or EU, or match on an entirely different column such as adgroup. Of course, all these options depend on a consistent and predictable campaign and adgroup naming system. We created a DatabaseSpy Project to collect all our favorite SQL queries for sharing and convenient reuse. Here is the query we used to generate the chart right in DatabaseSpy that appears at the top of this post: ChartQueryCapture This query goes beyond simple SQL reporting to perform calculations on a subset of the data and format the results. Database Reports We designed reports for the executive team using Altova StyleVision, based on the queries and charts we had already designed in DatabaseSpy. We simply copied our queries from the DatabaseSpy SQL Editor window and added them as sources in the StyleVision Design Overview window. Saving our report design in a StyleVision SPS stylesheet makes it is easy to regenerate an updated version every month. Here is the HTML output for a SemanticWorks Keyword Trends report based on the query above, displayed in the StyleVision Preview window: clip_image009 If you follow the conventional wisdom for building your own paid keyword campaigns, you will develop segmented campaigns with many small, highly specialized ad groups, and you may also find yourself overwhelmed by the data in Adwords reports. If you’d like to try managing your own keywords the way we describe here, a fully functional trial of the Altova MissionKit is available.

Tags: , , , , ,

Creating XML from Relational Databases


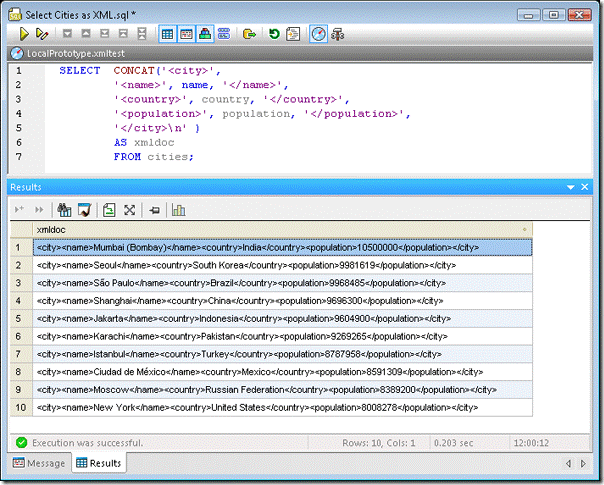
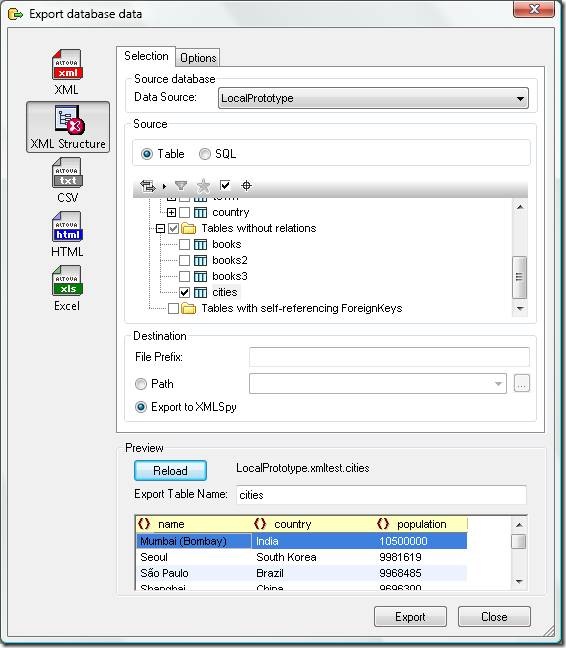
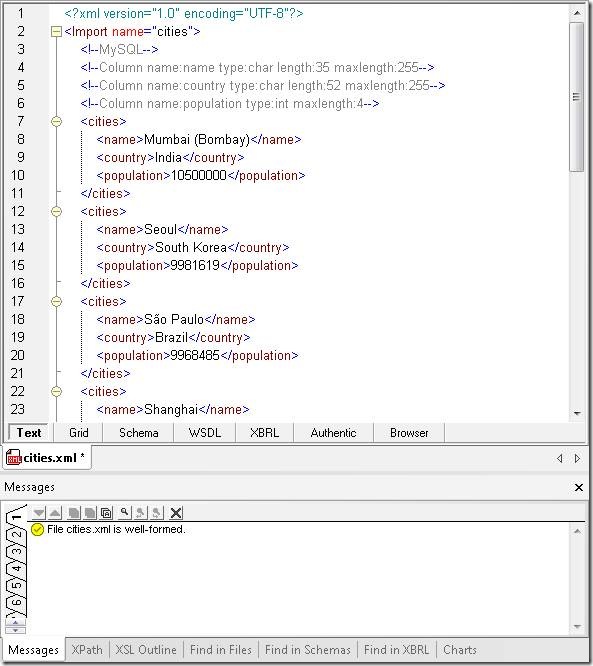
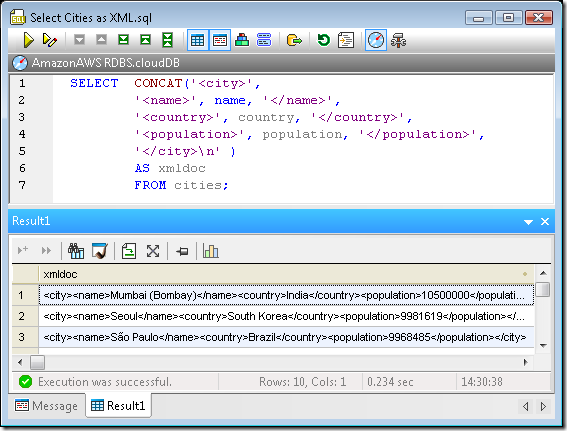
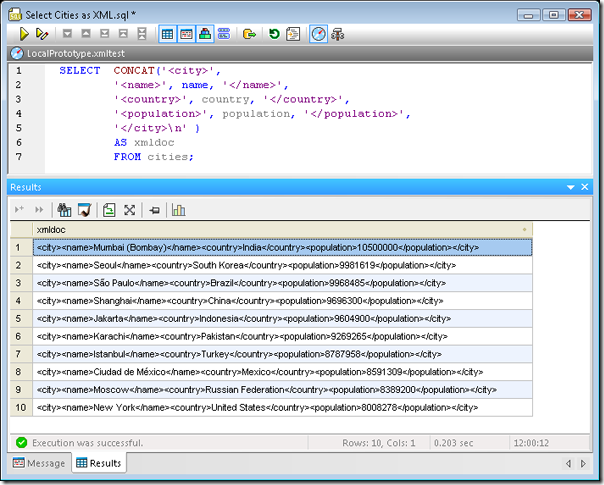
Sometimes following an example someone else created is a good way to get a quick start on a project. The downside is you might miss a better, more efficient solution. In our recent post on XML in the Cloud, we used DatabaseSpy to connect to a local MySQL database and to the Amazon Relational Database Service in the cloud. We used the Concat( ) function in a SQL SELECT statement to create XML formatted output from non-XML data as shown below. DatabaseSpy SQL query and result Our SELECT statement was based on an example in the MySQL documentation on XML support. Let’s take a little deeper look at the problem this statement tries to address. You can copy a DatabaseSpy Results table like the one displayed above and paste it into an editing window in XMLSpy, but the Results table alone does not create a well-formed XML document. To be well formed according to the W3C definition, an XML document must contain a root element. All other elements and logical structures must nest within the root. You can also think of the root element as a wrapper around the entire XML content, the same way the element <city></city> encloses each line in our original results. A Better Way to Create XML from Relational Data We don’t need to manually edit the results to add a root element, nor do we need to adapt our already-complicated SQL query to add the root. DatabaseSpy lets us easily export well-formed XML documents from database tables that contain ordinary data like our cities table. In the DatabaseSpy Export dialog we can choose XML Structure as the output format, click the cities table to select it from the database hierarchy, and choose XMLSpy as the destination. The Preview section at the bottom of the Export dialog shows a view into the table contents. DatabaseSpy Export Dialog When we click the Export button, DatabaseSpy formats the relational data with XML element names derived from the column names of the table and sends the resulting output directly to XMLSpy. The screenshot below shows a portion of the file in XMLSpy. The Message window at the bottom verifies the file is well formed. XMLSpy Editing window and Message window Note that DatabaseSpy supplied the root element <Import name = “cities”> and added comments to describe the datatypes of the database table columns. And, we did not have to construct a SQL statement with a cumbersome Concat( ) function. We began this post to address the simple requirement for a root element to complete the output of the Concat ( ) function we described earlier. When real-world projects require converting from relational databases to XML, the requirements are likely to be much more complex. Altova XMLSpy connects directly to all popular databases to work with XML technologies and relational data. XMLSpy lets you easily create an XML Schema from a database structure, or create a database schema from an XML Schema. XMLSpy also includes advanced editors and debuggers for XQuery and XPath for XML stored directly in databases, along with specialized support for XML features in Microsoft SQL Server, IBM DB2, and Oracle databases. As more industries adopt and evolve XML-based standards for information interchange, a common need is to convert data stored in legacy databases to XML. Altova MapForce connects to databases and allows you to map and transform relational data to be compatible with one or more XML Schemas. You can use your mapping to perform a one-time data conversion, you can save and re-open your mapping to perform another conversion later, or you can instruct MapForce to generate royalty-free source code from your mapping to include in your own project when repeated conversions are required. If you’d like to see for yourself how well Altova tools can generate well-formatted XML from relational databases, download a free trial of the Altova MissionKit.

Tags: , , , , ,

Using Charts to Effectively Communicate Data


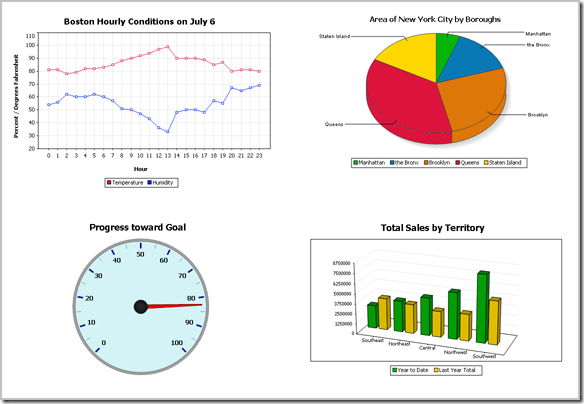
Altova first added support for charts and reporting the Altova MissionKit with the launch of Version 2011 last September. The v2011 reporting functionality includes options for line charts, 2D and 3D bar charts, 2D and 3D pie charts, round gauge and bar gauge charts. Here are a few examples: Charts created with the Altova MissionKit v2011
Advanced chart features in v2011r2

Version 2011 Release 2 of the Altova MissionKit, introduced on February 16, adds an exciting group of enhancements to the chart and reporting features in XMLSpy, StyleVision, and DatabaseSpy. The chart design options and user interface work the same way in all three applications, so MissionKit users can work intuitively and productively as they move from processing XML data in XMLSpy, to preparing charts for a business intelligence report with StyleVision, and even when they create graphical displays directly from SQL query results in DatabaseSpy. The wide range of new customizable charting features introduced in version 2011 release 2 includes:

  • Stacked Bar charts
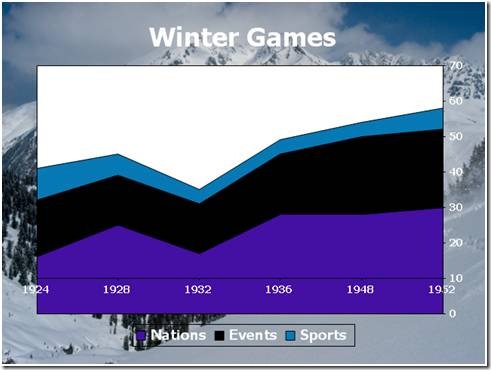
  • Area charts
  • Stacked Area charts
  • Candlestick charts
  • Chart overlays
  • Background images and color gradients
  • Ability to change position of axis labels
  • And more!

Now you can create attractive and informative charts to represent a wide variety of data sets without exporting data to a dedicated charting application. Charts created using the Altova MissionKit are not limited to any specific presentation technology – for instance you can use StyleVision to include charts in HTML, Microsoft Word, RTF, or PDF documents, or you can save charts created in DatabaseSpy in a variety of image formats at the custom resolution you specify. In this post we will show some examples of the new charts and features available in all three MissionKit reporting and charting applications – XMLSpy, StyleVision, and DatabaseSpy.

Stacked bar charts

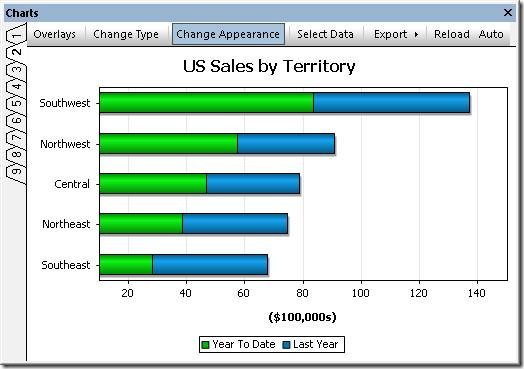
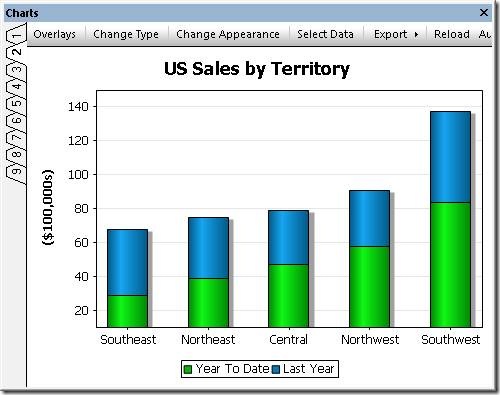
Stacked bar charts are a variation on bar chart presentation and are especially useful when multiple ranges of data need to be illustrated. Stacked bar charts are also useful to more clearly illustrate data in a smaller area. The image below shows a stacked bar chart to illustrate the performance of a sales team by region over two years Stacked bar chart Note that the combined height of each stack in the Stacked Bar Chart represents the total sales over the two-year period for each Territory, since the sales for Last Year are added above the Year To Date numbers. Stacked bar charts complement regular bar charts and 3-D bar charts to offer users the greatest flexibility in illustrating SQL query results. If the user prefers horizontal bars, a checkbox labeled Draw X and Y exchanged in the Change Appearance tab selects that orientation. Chart orientation option Horiztonal stacked bar chart This orientation option is also available for other 2-D bar charts, line charts, area charts, and candlestick charts.
Area charts

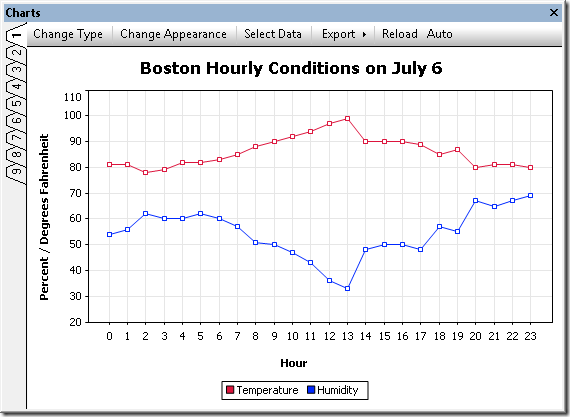
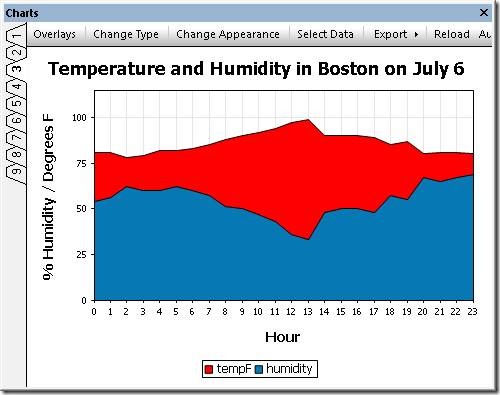
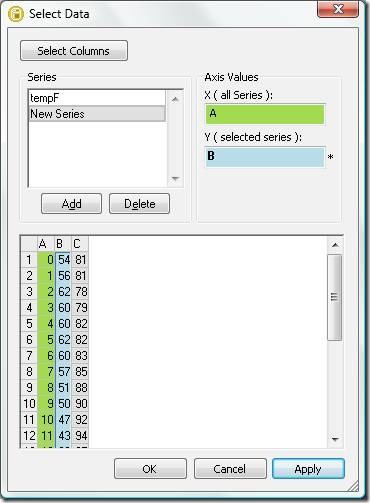
Area charts are similar to line charts, with shading applied to make a more graphically appealing display. The area chart below shows a record of temperature and humidity changes by hour over the course of one day. Creative application of color can emphasize the point! Area chart To successfully build an area chart, the analyst must consider the values in each data category. As the area chart is constructed, each category forms an opaque layer on top of the layers for data retrieved previously. In the case illustrated above, Temperature was always a larger number than Humidity, so a SQL query was constructed in DatabaseSpy to retrieve the Temperature value before Humidity to prevent Temperature from acting like a curtain to hide the Humidity data. However, if the data columns appear in a sequence with values in increasing order, the last layer would overlap and hide all the preceding layers. In that case, the chart tab heading titled Select Data lets the user add and delete columns from the results to re-sequence the data correctly. The Select Data column also lets the user edit the names assigned to each column on the X-axis label. Select Data dialog As alternative solution, the Transparency option in the Change Appearance tab lets the user adjust color levels to allow hidden layers to show through.
Transparency dialog

Stacked area charts

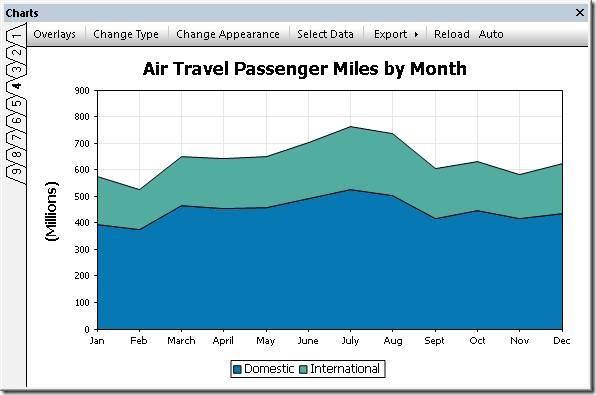
As implied by their name, Stacked Area charts layer the columns of a data set to illustrate the overall sum of a data series. Stacked Area charts also eliminate the potential overlapping data problem that can occur with regular area charts. The chart below shows a table of air passenger revenue miles traveled by month, with individual regions for domestic and international travel. Stacked area chart The Stacked Area chart creates a graphical representation of the total of Domestic and International miles, even though the total miles value was not part of the provided data. This is apparent at the top of the January entry, where the International region intersects the Y axis just below 600 (the original data showed 392 million Domestic miles and 181 million International miles, for a total of 573). A strategic data analyst will always consider the nature of the data to be reported when choosing any particular chart type. For instance in the weather example we used above, adding temperature and humidity values in a stacked bar chart would not be logical!
Candlestick charts

Candlestick charts were originally developed by a wealthy Japanese businessman who began trading at the local rice exchange around the year 1750. He kept records of the local market psychology, learning to boost his profits by carefully monitoring prices and not rushing into trades. Today, charts are used to represent financial data such as stock prices over a period of time. Every day the market is open, each stock has four relevant data points that can be rendered in a candlestick chart: the price at market opening, the price when the market closed, the high price during the day, and the low price during the day. Investors and financial analysts like to view these indicators to gauge the stock’s performance over a period of time. In the candlestick chart below, each solid bar represents the range between the opening and closing price and the thin vertical line through each bar shows the extent of the high and low prices for the day. Candlestick chart In this version of the chart, following common convention, the color of each bar signals whether the stock was up or down for the day. If the bar is green, the stock was up for the day– it opened at the price indicated by the bottom of the bar and closed at the price indicated by the top. If the stock was down for the day, the bar is red and the symbolism is reversed – the stock opened at the price indicated at the top of the bar and closed at the price shown by the bottom. Numerous options are available to set line and fill colors, the Y-axis range and values, and more. Because they were intended to be printed in black and white, the original candlestick charts used empty bars to indicate the price increased and solid bars to indicate price decreases. The Altova MissionKit offers this option: Candlestick chart in black and white Another candlestick chart variation omits the opening price and simply illustrates the range by a vertical line and the closing price by a horizontal line. This option is automatically supported when a data set only includes the high, low, and closing prices. Candlestick chart without opening price
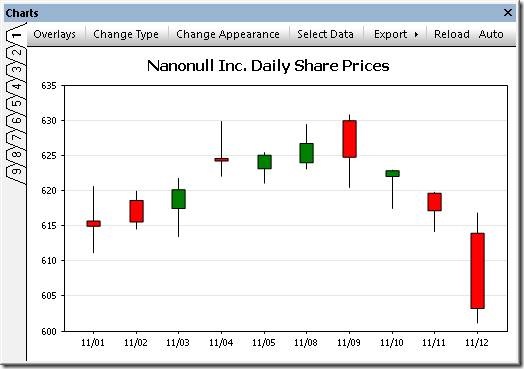
Chart overlays

The Overlays feature lets you combine multiple charts in a single image. Each overlay chart has unique settings and can even be generated from a separate data file. The image below shows a candlestick chart of a stock’s daily prices with the daily sales volume in a bar chart overlay. Candlestick chart with bar chart overlay

Support for background images & color gradients

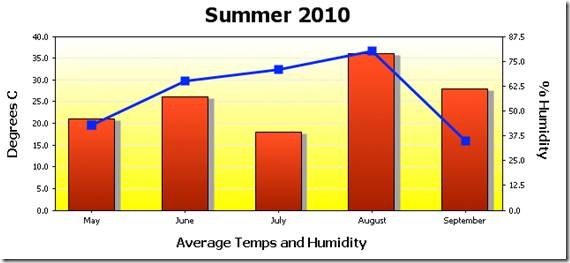
The ability to specify background color gradients and background images gives you even more flexibility for creating customized, eye-catching charts. Overlaying one chart on another lets you visualize multiple data sets with different Y-axes and types. Area chart with a background image The Change Appearance dialog lets users select a background image, as in the Winter Games chart above, or apply a background color gradient, as in the Summer 2010 chart below. Change Appearance dialog Bar chart with a line chart overlay and background color gradient If you’d like to see for yourself how easy it is to use Altova tools to create attractive charts from XML and database data, download a free trial of the Altova MissionKit.

Tags: , , , , , , ,

What Do Industry Authors Have to Say About Altova?


Authors of various industry reference books ranging from SOA and Web services to XML continue to use and recommended Altova tools. The latest update to the Cold Fusion book series – “ColdFusion 9 Developer Tutorial” is an update to John Farrar’s “ColdFusion 8 Developer Tutorial”. In this latest update, Farrar uses the Altova MissionKit, our suite of XML, database, and UML tools to do all his XML work for the book. According to Farrar, “I have a suite of tools from Altova and find they do what I want. I can create XPath, XML Schemas, and more from their tools and don’t ever feel the need to look for a new tool.” ColdFusion9_Farrar Farrar, a ColdFusion expert, teaches the basics of ColdFusion programming, application architecture, and object reuse. He then shows off a range of topics including AJAX library integration, RESTful Web Services, PDF creation and manipulation, and dynamically generated presentation files. So whether you need an overview of XML technologies, the latest information on working with ColdFusion, or want to delve into Web services, you’ll want to check out the Altova Reference Books page on our Web site.

Tags: , , , , , , , , , , , ,

XML in the Cloud


Working with Altova Tools and the Amazon Relational Database Service (Amazon RDS)

More and more enterprises are discovering the advantages of implementing database applications in the cloud:

  • High availability and reliability
  • Automatic scaling
  • Freedom from hardware costs and maintenance requirements

In this blog post we demonstrate how to connect to the Amazon Relational Database Service (Amazon RDS) and build a small database using Altova DatabaseSpy. Since the database Connection Wizard is consistent across the Altova MissionKit, you can connect the same way using XMLSpy, MapForce, or StyleVision. If you would like to follow the steps described below for yourself, you will need to sign up for an Amazon Web Services (AWS) account at: http://aws.amazon.com/rds/ You can also download a fully-functional free trial of the Altova MissionKit or any individual Altova application at: https://www.altova.com/download-trial/

Build a Local Prototype

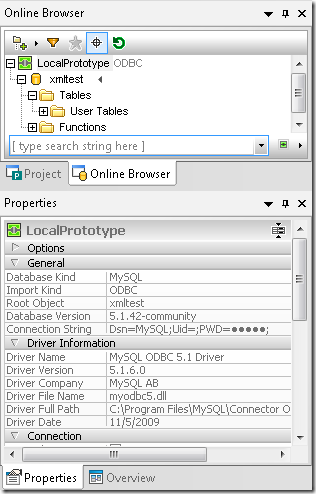
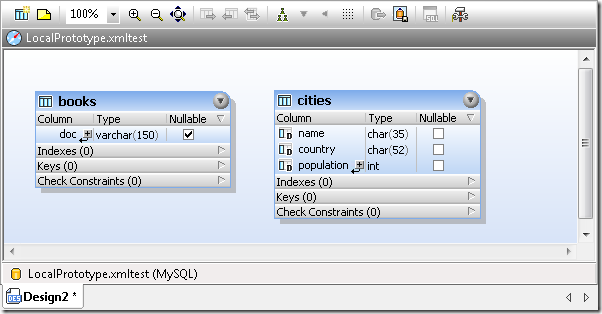
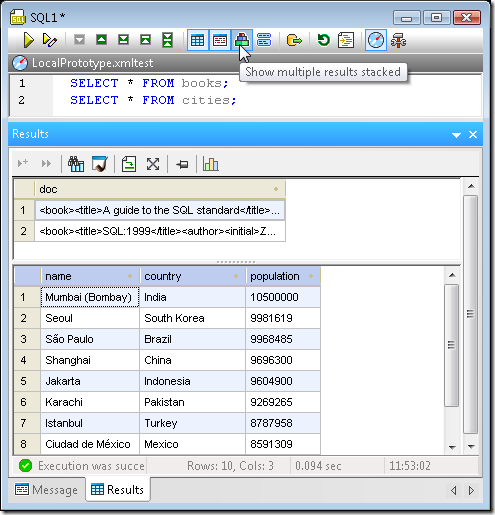
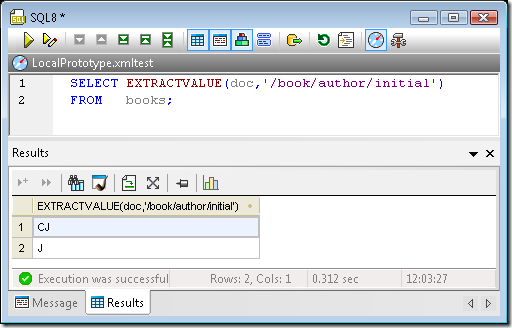
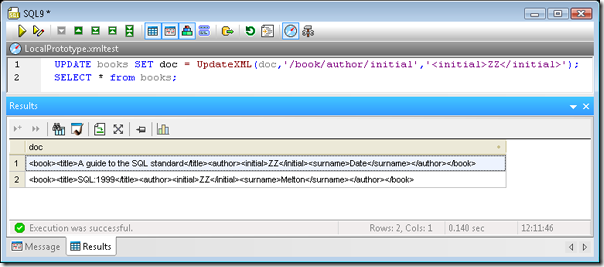
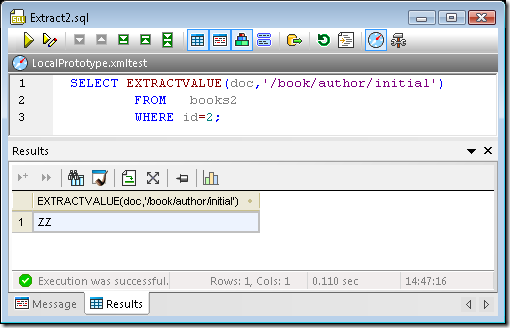
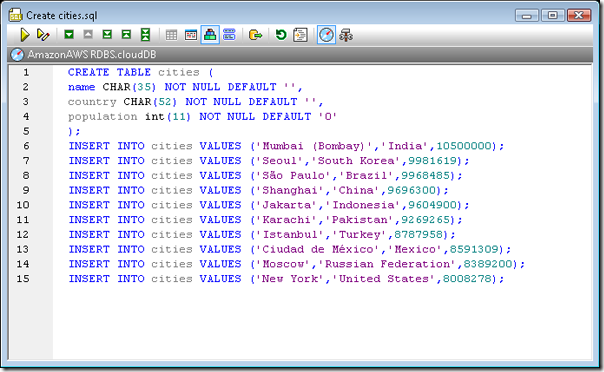
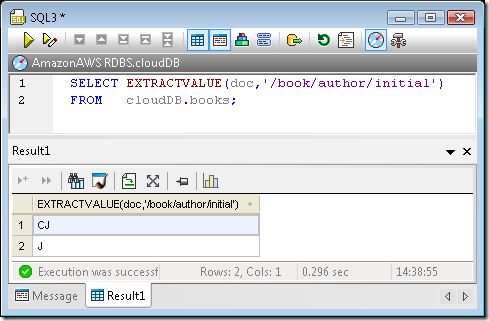
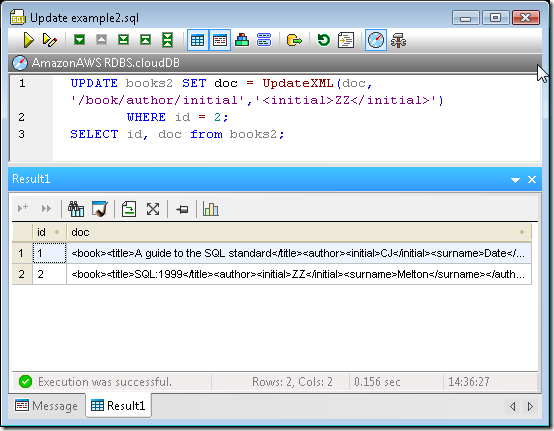
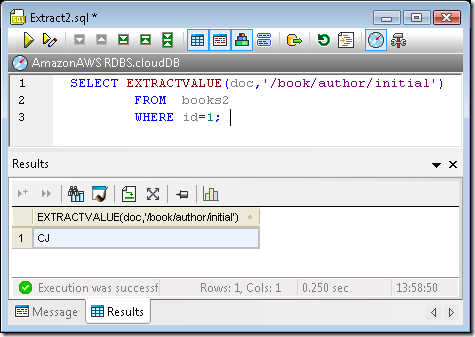
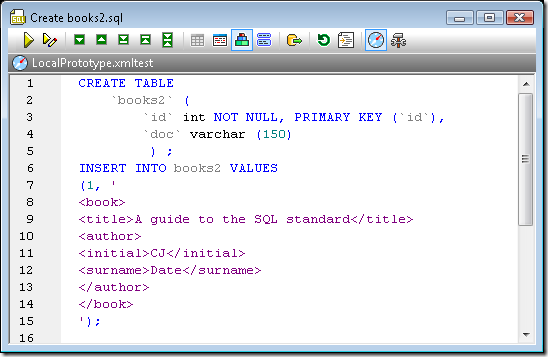
The Amazon RDS is based on MySQL, so we will build a small local database in the MySQL Community Edition, then migrate to the Amazon RDS and test our database in the cloud. Although MySQL does not support XML as a data type for database columns, MySQL 5.1 and 6.0 do support some operations for XML data stored as text. For this exercise we will adapt and extend some of the MySQL XML examples at the MySQL reference resources listed here: http://dev.mysql.com/doc/refman/5.1/en/xml-functions.html http://dev.mysql.com/tech-resources/articles/xml-in-mysql5.1-6.0.html http://dev.mysql.com/tech-resources/articles/mysql-5.1-xml.html First, we launched DatabaseSpy and connected to our local MySQL Community Edition. We created a new data source named LocalPrototype, and created a new database schema that we named XMLtest. The DatabaseSpy Online Browser and Properties windows are shown here: DatabaseSpy Project and Properties windows Next, we created two tables called books and cities and inserted data by following the examples in the MySQL documentation. Here is a DatabaseSpy Design View of our tables: DatabaseSpy Design View We can run select queries and display the contents of our tables in stacked results windows: DatabaseSpy stacked results windows Note that the doc column of the books table contains XML data, although it was defined as varchar(150). MySQL supports two functions for working with XML in text fields, ExtractValue() and UpdateXML() that can operate on individual elements via XPath expressions. Below is a simple ExtractValue() query to return only the author initials from every row in the books table: ExtractValue( ) function The UpdateXML() function can be used to modify the contents of individual XML elements using a SQL expression. In the screen shot below, the query on line 1 updates the every row of our books table, and the query on line 2 returns the new values: UpdateXML( ) function We can also use the Concat( ) function to add XML elements to non-XML data such as the cities table, as shown below: Concat( ) function So far, our XML queries have operated on all rows of each table. To facilitate queries for a single row, it’s handy to add a column top the table to hold a unique row index. We can make a copy of our books table and add a column called id to hold the row index. The id column also makes a convenient foreign key to reference an individual XML document in our table from a row in another table. For instance, you might define one table to contain names of job candidates, with a foreign key to reference the XML-formatted resume for each candidate, stored in a separate table. You can use the SQL Editor in DatabaseSpy to generate a CREATE statement for the existing books table and edit it directly, or you can use the DatabaseSpy Design Editor to build the table graphically. (For more information, see the DatabaseSpy section of the Altova Web site.) Since we are planning to run the same queries later in the Amazon RDS, we combined a SQL CREATE statement and SQL INSERT statements into one script for the books2 table. The screen shot below shows part of the script for books2: Create table script We can run a query of the books2 table that shows the unique id column for each row: SQL SELECT query Now we can enhance our UpdateXML() and ExtractValue() queries to act on an individual row: blogSnap8 blogSnap9 This gives us a good baseline set of examples to take to the cloud and test in an Amazon RDS.

Connect DatabaseSpy to the Amazon RDS Cloud

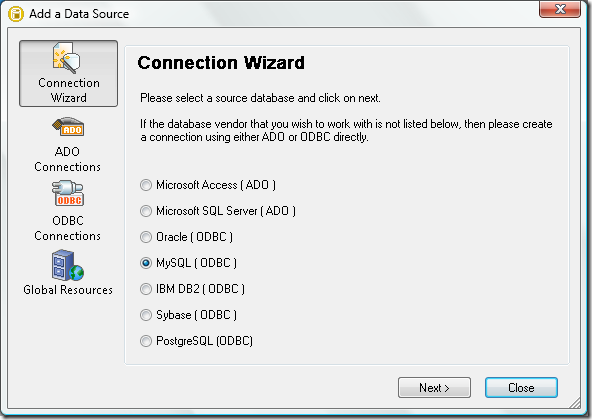
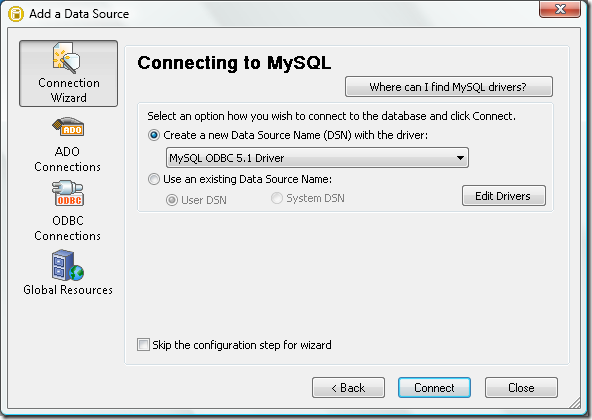
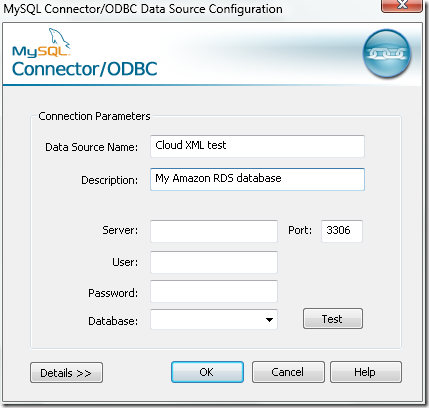
After you follow the instructions at the AWS Management Console to create a database instance on Amazon RDS, the Connection Wizard makes it easy to get started with DatabaseSpy. Simply choose the MySQL option as shown here: DatabaseSpy Connection Wizard The first time you connect, you will need to create a new DSN. After the first time, you will be able to select the DSN from a list by choosing the “Use an existing Data Source Name” option. You can even use the original DSN when you go back to connect from XMLSpy, MapForce, or StyleVision. Connecting to MySQL In the connector dialog, fill in the following information:

  • Data Source Name: This is the name that will be listed in the DatabaseSpy Project. window and in the list of existing data sources when you connect again.
  • Description: Information for your own reference.
  • Server: This is the Endpoint name listed in your Amazon RDS account dashboard.
  • Port: 3306 – make sure your IT department isn’t blocking this port with a firewall!
  • User / Password: This is a user you set up in Amazon RDS.
  • Database: The default database name you configured when launching your RDS instance.

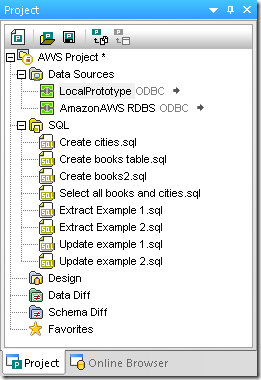
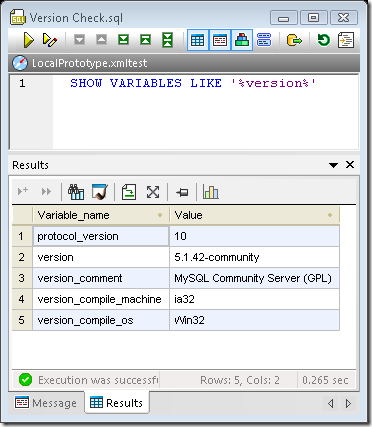
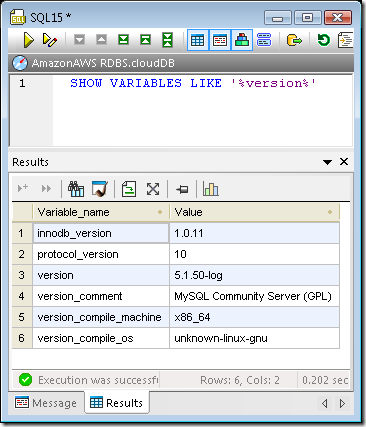
MySQL Connector/ODBC We connected to our Amazon RDS cloud database in the same DatabaseSpy project we built for the local prototype. Here is a screen shot of the project window showing both Data Source Names and the working SQL files we added to our project: DatabaseSpy Project window with cloud connection Before we build our tables and run the queries, it will be interesting to check the versions of each system. The screen shots below show a query that requests version information for each system. Note that the gray bar directly above each query indicates which data connection the SQKL statement is assigned to. Version reported by the local server Version reported by the cloud server The Amazon RDS reports it is running version 5.1 of the MySQL Community Server, the same as our local prototype – a promising omen!

Migrate the Local Project to the Cloud

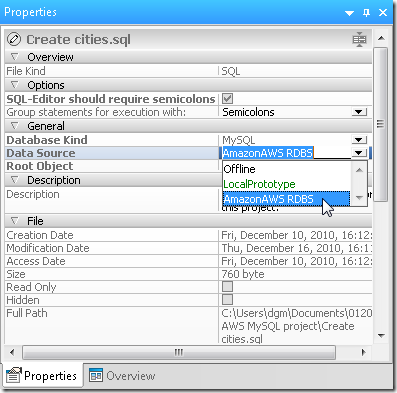
We can open each of our original table creation scripts and run them in the cloud database by re-assigning the execution target  in the Properties window: Data Source selection in the DatabaseSpy Properties window The gray Execution Target bar near the top of the SQL Editor window identifies the cloud Amazon RDS database as the query target: DatabaseSpy SQL Editor window After similarly creating the books and books2 tables, we can run each of the SQL queries in the cloud database. ExtractValue() function for all rows example: ExtractValue( ) function Concat() query to create XML output from non-XML data in a table: Using the Concat( ) function to add XML elements to data from a non-XML table UpdateXML() example for a single row in a table. Using the UpdateXML( ) function in the Amazon RDS cloud ExtractValue() for a single row: blogSnap23

Conclusion

In every test we performed, Amazon RDS behaved exactly like the local MySQL community edition. This behavior it much more efficient for developers to build and test new cloud database applications, or enhancements to existing applications, without incurring the cost of cloud resources for development iterations. We also verified the operation of MySQL XML functions for XML data stored in text columns in the cloud databases. Our XML data was very limited – the text column in our books table was limited to 150 characters. However, MySQL lets you store much larger XML documents in a single column. Every table has a maximum row size of 65,535 bytes. Even if your table uses an index column, this means a varchar column for one XML entry could be over 64k bytes. If you need to store even larger XML documents, MySQL offers MediumText and LongText data types, similar to BLOBs. MediumText can hold over 16 million single-byte characters and LongText can hold up to 4 GB. Although not illustrated in this blog post, we have successfully tested ExtractValue() and UpdateXML() functions with MediumText and LongText data types. When you need to store XML data files that large, writing XPath expressions to resolve individual elements can become a development challenge. The XPath Analyzer included with XMLSpy is an invaluable tool that facilitates the testing and debugging of XPath 1.0 and 2.0 expressions. As you type an XPath expression into the analyzer, XMLSpy evaluates it and returns the resulting node set in real time. This can save hours of debugging time spent trying to understand and track down XPath problems. In future blog posts we’ll explore other ways XMLSpy, MapForce, DiffDog, and DatabaseSpy can help developers accelerate creation of cloud application with Amazon RDS. We look forward to seeing you back soon! If you’d like to see for yourself how well Altova tools work with Amazon RDS, download a free trial of the Altova MissionKit.

Tags: , ,

MissionKit 2011 Now Available in Japanese


With the release of Version 2011 we are thrilled to bring you the Altova MissionKit in Japanese. Now all the Altova tools available in the MissionKit have been fully translated into Japanese. Like the English and German versions of the tool suite, the fully translated Japanese language version provides users with powerful functionality for XML and Web development, data mapping and integration, rendering and publishing of XML, XBRL, and database data, UML modeling, and more. All the tools available in the new Japanese language version of The MissionKit are available at the same cost as the English versions, and current Version 2011 users can now unlock any language version using their existing key code. missionkit_jp If you haven’t checked out our latest release – Version 2011, download a free, 30-day trial today! The Japanese language version of all the MissionKit tools can be purchased from the Altova Online Shop or through your preferred reseller.

Tags: , , , , , , , , , , ,

New Software Feature: Charting in DatabaseSpy 2011


Multi-database query, design, and database comparison tool. A colorful, eye-catching chart is much more vivid and communicates meaning more quickly than a table of numeric data. As part of the v2011 launch of the Altova Missionkit on September 8, 2010, DatabaseSpy 2011 includes a new SQL charts tool that provides a wide variety of charting features to graphically represent SQL query results. DatabaseSpy 2011 supports the following chart types to provide the most appropriate representation of various data sets:

  • Line charts
  • 2-D and 3-D pie charts
  • 2-D and 3-D bar charts
  • Round gauge and bar gauge charts

A line chart generated from SQL query results by Altova DatabaseSpy DatabaseSpy SQL Charts Tool Supported Databases DatabaseSpy 2011 supports multiple database types and can generate charts from the results of SQL queries to the following databases:

  • Microsoft® SQL Server® 2000, 2005, 2008
  • IBM DB2® 8, 9
  • IBM DB2 for iSeries® v5.4, 6.1
  • Oracle® 9i, 10g, 11g
  • Sybase® 12
  • MySQL® 4, 5
  • PostgreSQL 8
  • Microsoft Access™ 2003, 2007

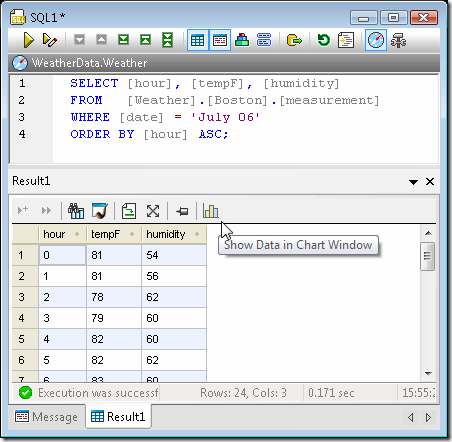
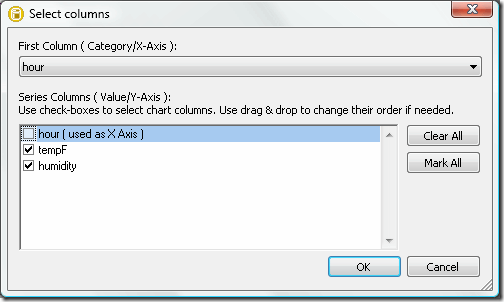
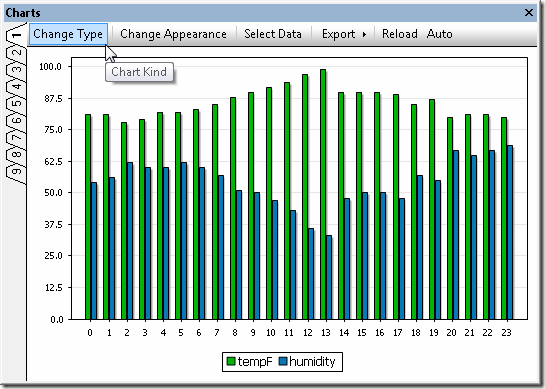
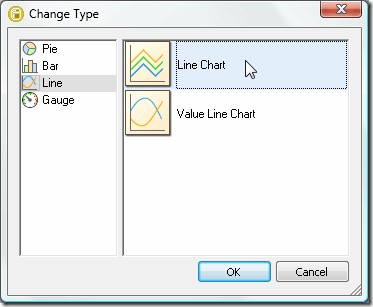
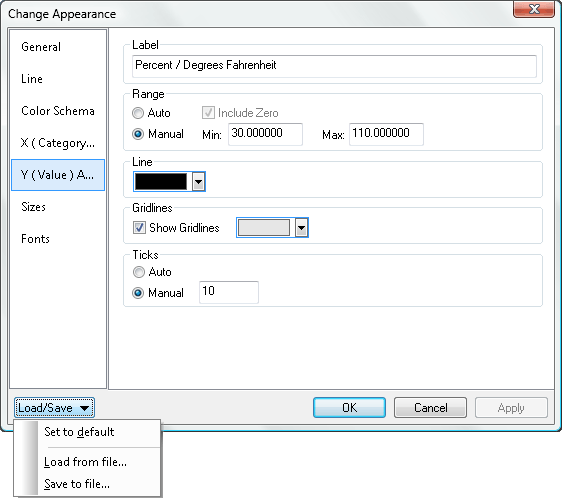
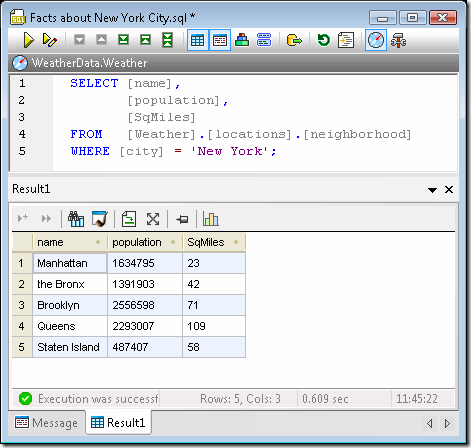
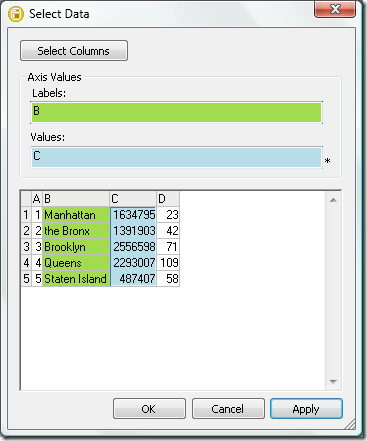
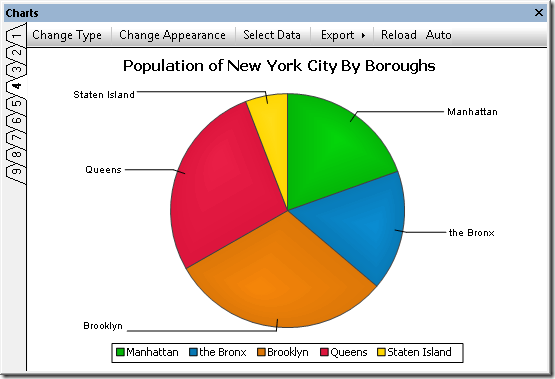
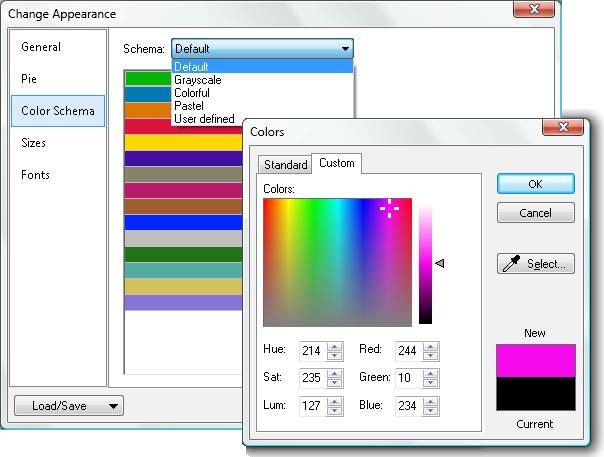
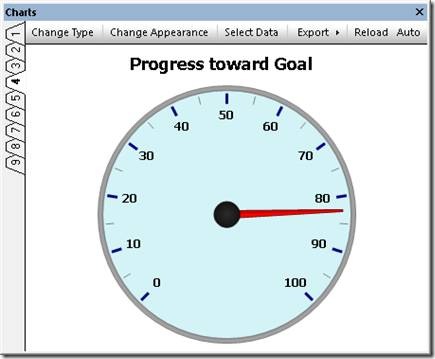
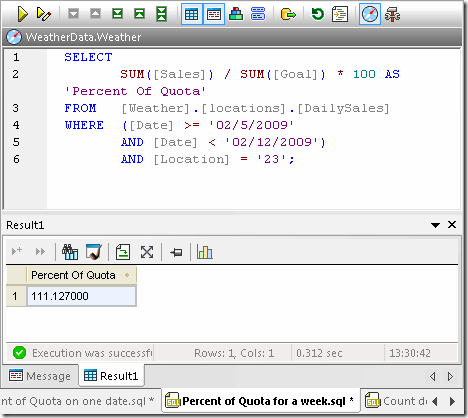
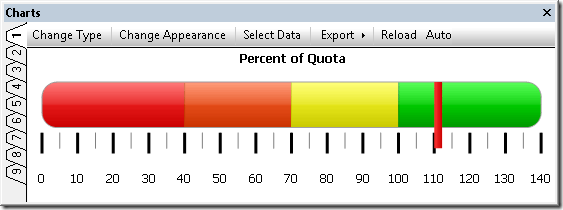
Charting SQL Query Results A link in the Altova DatabaseSpy 2011 SQL Editor Results window toolbar opens the Chart Selection dialog to initiate data charting. A SQL query and result table in Altova DatabaseSpy The chart tool icon opens the Select columns dialog, where users can specify which column of the Results table to use for the X-axis. Users can also change the order of value columns, or even leave one or more results column uncharted. This feature permits multiple charts to be generated for subsets of data from a single query that retrieves many table columns. DatabaseSpy SQL Chart Tool Select Columns dialog The data is initially plotted using the default chart type and settings in a new Charts window. Like other DatabaseSpy helper windows, the Charts window can be unpinned, moved, and resized, as a floating window. The Charts window has nine tabs that permit users to specify properties of nine different charts that can even be assigned to different query results. A bar chart generated from SQL query results by Altova DatabaseSpy The Change Type dialog gives users instant access to a wide variety of other chart styles. DatabaseSpy SQL Chart Tool Change Type dialog Within each chart type, sub-menus specify all the details of the chart appearance. Numerous customization options are available for each chart type, including chart titles, foreground and background colors, definition of axis ranges and labels, control of fonts, text colors and sizes, and more. A pull-down menu also lets users save and reload customized chart settings in files, for instance to store standardized chart styles and reuse them with multiple query results. The screenshot below shows a few of the settings for the line chart at the top of this page, which illustrates the same temperature and humidity data shown in the SQL query screenshot. DatabaseSpy SQL Chart Tool Chart Appearance dialog The screenshot below shows a bar chart reporting total sales for the year to date by sales territory. This is a typical example of a chart style that can be reused in a report that is frequently updated with the latest sales data. A 3-D bar chart generated from SQL query results by Altova DatabaseSpy Multiple Charts from a Single SQL Query Results Table Generating multiple charts from the same SQL query is simple and straightforward by selecting different columns of data in the Results table. The SQL query in the screenshot below returns the population and land area of the boroughs that make up New York City: A SQL query and result table in Altova DatabaseSpy Users can choose any tab in the Charts window, then assign data by clicking the Select Data menu option in the Charts window menu bar. DatabaseSpy SQL Chart Tool Select Data dialog Here are examples of an ordinary pie chart and a 3-D pie chart generated individually from the population and square miles data columns of the Results table: A 2-D pie chart generated from SQL query results by Altova DatabaseSpy A 3-D pie chart generated from SQL query results by Altova DatabaseSpy DatabaseSpy 2011 lets users change the chart colors by selecting an alternate palette or any custom colors. Customization of chart colors in Altova DatabaseSpy Gauge Charts from a Single Value or Calculated Results Gauge charts are used to illustrate a single value and show its relation to a minimum and a maximum value. For a round gauge chart, users can specify the beginning and ending values of the range, and the starting and ending locations on the gauge. DatabaseSpy 2011 enables complete gauge customization through selection of the background color, border color, needle color, text font, size, and color, and more. A round gauge chart generated by Altova DatabaseSpy DatabaseSpy 2011 can generate charts from results tables that contain relational data, or from results of calculations performed by SQL queries. Gauge charts are a good fit for illustrating a single calculated value. The screenshot below shows a percent of quota calculation in a DatabaseSpy 2011 SQL Editor window, based on a table of stored daily sales and sales quota data. SQL query that generates a single calculated result in Altova DatabaseSpy The calculated value can be more dramatic when represented in a bar gauge chart, where DatabaseSpy 2011 permits multiple background colors defined by ranges along the axis, as shown below. clip_image018 Export Charts for Reports DatabaseSpy 2011 exports charts to image files in .png, .bmp, .gif, or .jpg files in customized sizes, independent of the size of the chart window on the screen to create eye-catching visual elements in reports of all types. Export option in the DatabaseSpy Charts menu Whether you are a developer, business analyst, research professional, or other database user, DatabaseSpy 2011 can generate elegant charts from SQL query results to illustrate your data reports – download a free 30-day trial today!
If you’d like to find out for yourself how well DatabaseSpy works with other Altova tools, download a free trial of the Altova MissionKit.

Tags: , , ,

UML Database Modeling in UModel 2011


As software applications interact with growing amounts of data, database designs and structures become critical to development of successful projects. UModel® 2011, just launched on September 8, 2010, adds a new feature that empowers users to extend software modeling functionality by modeling relational databases along with Java, C#, and Visual Basic software applications. UModel 2011 accelerates database modeling with features that permits users to:

  • Import existing tables from all popular relational databases to create UML database diagrams
  • Modify diagrams for existing tables and generate SQL database change scripts to synchronize the database
  • Design new database tables and relationships from scratch and issue SQL CREATE scripts

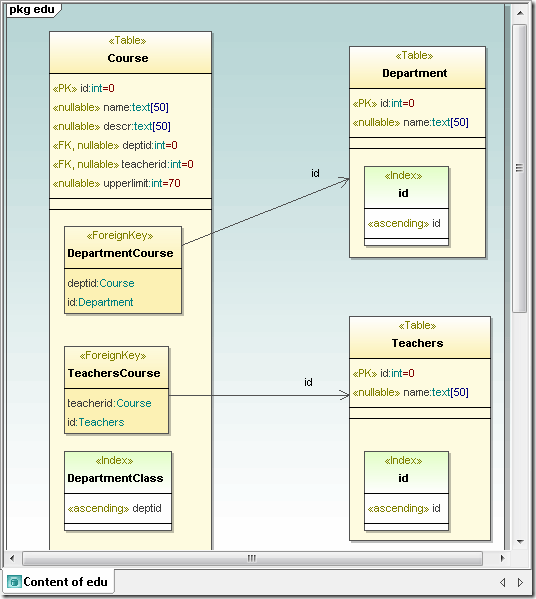
UML database diagram UModel Database Diagram Supported Databases The UModel 2011 database diagram functionality supports multiple databases and automatically adjusts SQL dialects, data types, and other specialized features for the following databases:

  • Microsoft® SQL Server® 2000, 2005, 2008
  • IBM DB2® 8, 9
  • IBM DB2 for iSeries® v5.4, 6.1
  • Oracle® 9i, 10g, 11g
  • Sybase® 12
  • MySQL® 4, 5
  • PostgreSQL 8
  • Microsoft Access™ 2003, 2007

UModel Database Diagram Elements UModel 2011 database diagrams support all the following database elements:

  • Database schemas
  • Tables
  • Views
  • Check Constraints
  • Primary / Foreign / Unique keys
  • Indexes
  • Stored procedures
  • Functions
  • Triggers
  • Database Relationship Associations
  • Database Relationship with Attributes

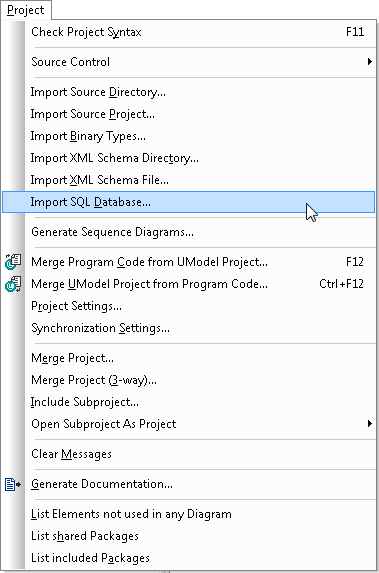
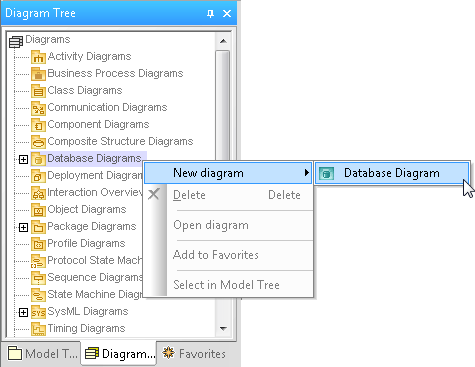
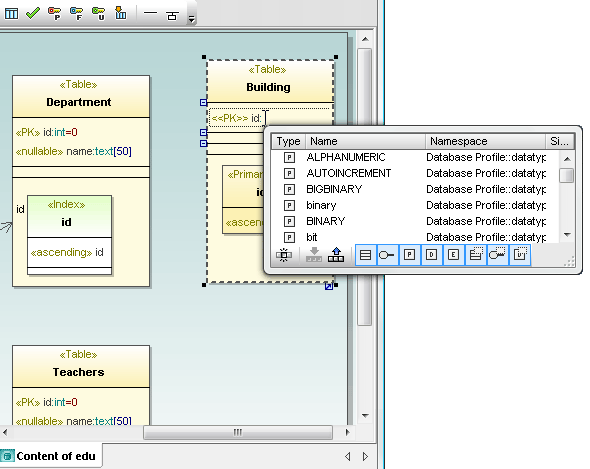
Import Existing Database Structures Users can import an existing relational database via a selection in the UModel 2011 Project menu. UModel Project menu The Import SQL Database option opens the UModel 2011 Database Connection dialog, with the Database Connection Wizard and all the additional connection options available in DatabaseSpy and other Altova MissionKit tools that interact with popular relational databases. UModel database connection dialog When importing a database, UModel 2011 also automatically adds a database profile to the project. UModel 2011 database diagrams are displayed in a special category in the Diagram Tree Helper window. UModel Diagram Tree helper window Modifying Databases in the Model UModel 2011 database diagrams use a dedicated toolbar with icons indicating database elements that are shared with DatabaseSpy, easing the learning curve between tools. UModel database diagram toolbar As editing proceeds in UModel 2011, the SQL Auto-completion helper window assists with creation of diagrams valid for the SQL database type. UModel database diagram SQL autocompletion window As an alternative to working directly in the diagram, users can also edit database elements in the Properties helper window. UModel database diagram Properties helper window Database Change Scripts When a developer synchronizes program code from the UModel project, changes in any database diagram generate a Database Change Script with SQL commands to implement the revisions. Database Change Scripts created in UModel can be saved as SQL files, executed directly in the database, or opened in a DatabaseSpy SQL Editor window via a convenient button in the UModel Database Change Script dialog. UModel Database Change Script Conversely, if another team member modifies a table directly in the database, a developer can update the UML model by merging the database changes. UModel Message window After synchronization of the UML model with the latest version of the database, the database diagram shows a new column in the Teachers table. UModel updated database diagram Like all other UModel diagram types, UModel 2011 lets users save database diagrams as image files and include them in automatically-generated project documentation. Visit the Altova What’s New page to learn more about all the new features in the Altova MissionKit 2011. Model databases along with system requirements, business rules, and application code for your next development project – click here to download a free 30-day trial of UModel 2011 today!

Tags: , , , , , ,

Using Altova Tools to Work with XML Data in the SQL Azure Cloud


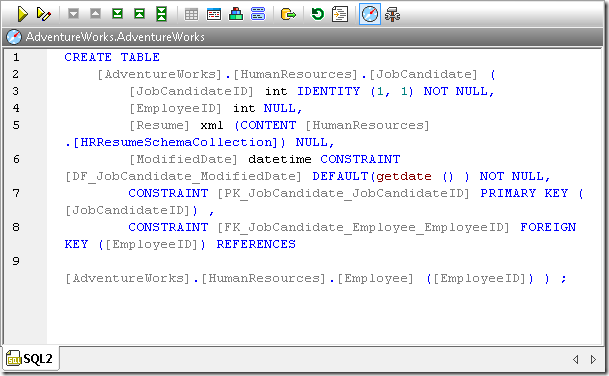
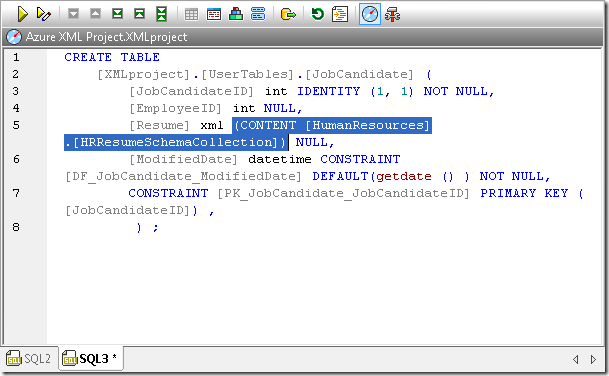
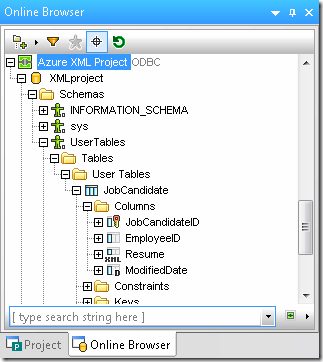
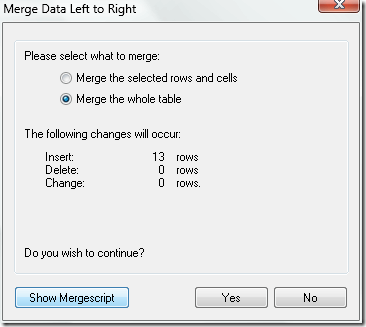
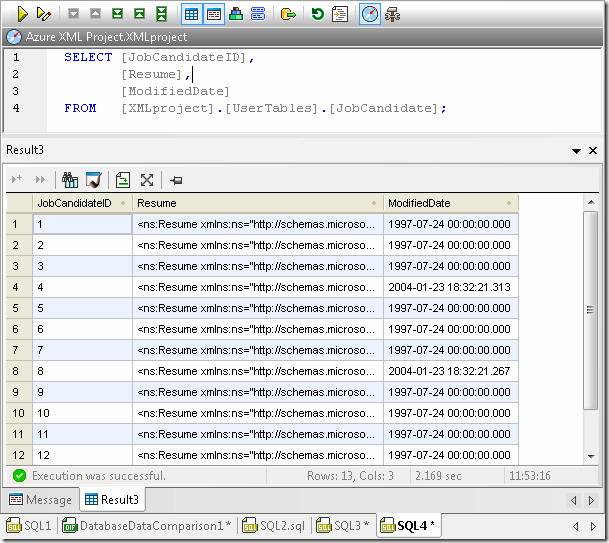
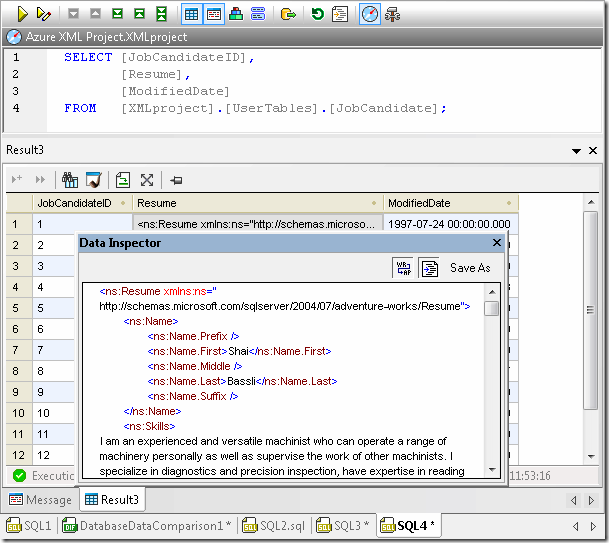
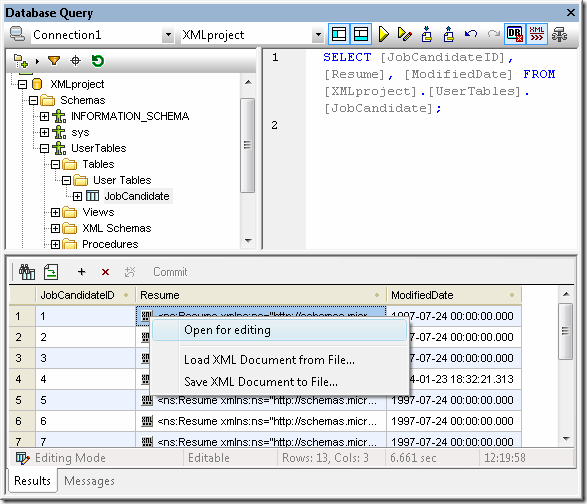
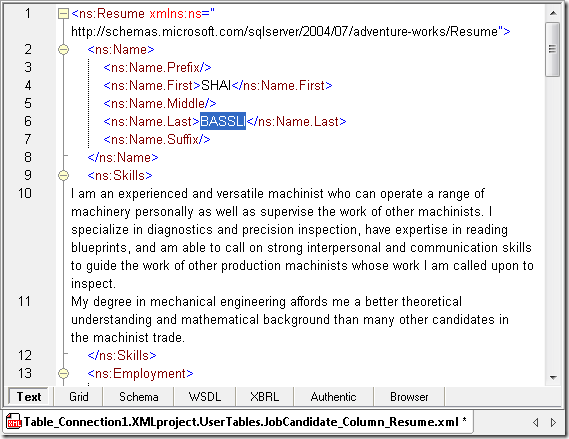
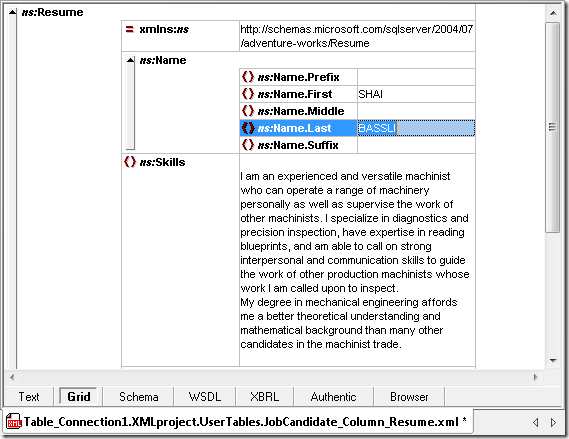
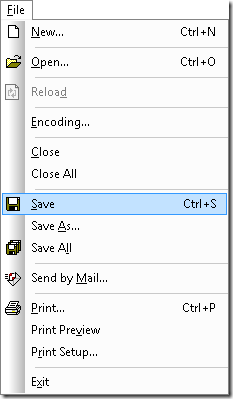
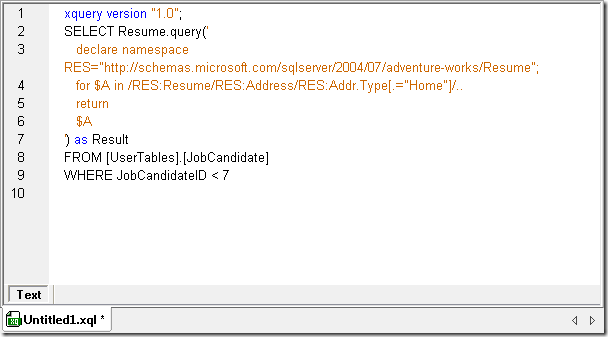
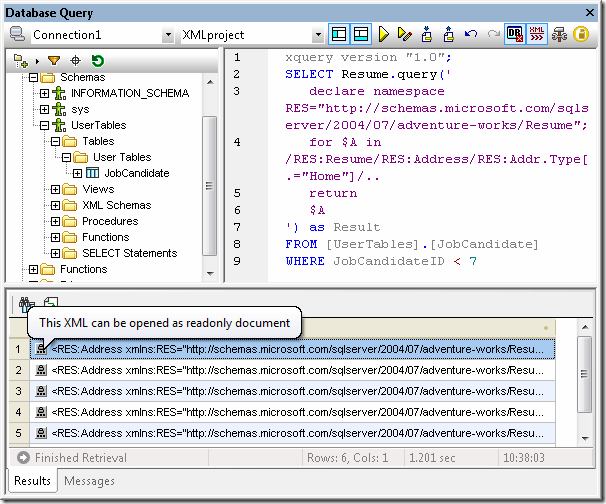
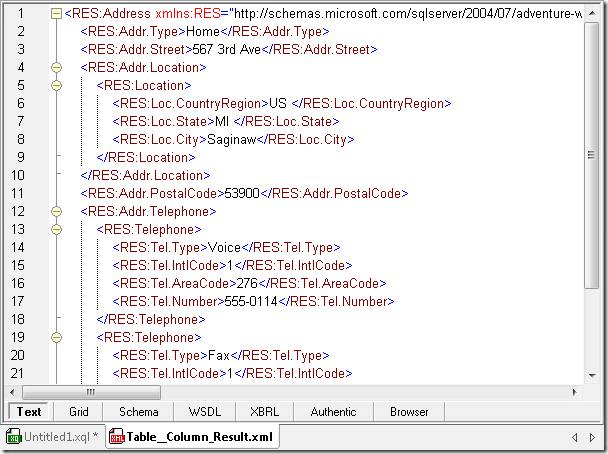
In an earlier post we discussed connecting to Microsoft SQL Azure databases with Altova DatabaseSpy and demonstrated database schema comparison and content comparison between a local database and the same database migrated to SQL Azure. In this post we will use a different method to migrate an existing table to SQL Azure and show you some tricks you can do with XML in the cloud. We started by creating a new database schema in SQL Azure. Then we created a DatabaseSpy project with a connection to a local copy of SQL Server Express running the AdventureWorks sample database, and a second connection to our new SQL Azure schema. DatabaseSpy Project helper window The AdventureWorks database contains a table called JobCandidate with some XML data we will use for a model for our SQL Azure XML contents. AdventureWorks JobCandidate table in the DatabaseSpy Online Browser window We can generate a CREATE statement for the existing table to use as a basis for the SQL Azure version. CREATE statement for the existing JobCandidate table We need to modify this statement to execute in our SQL Azure database. In addition to changing the database and schema names, we will remove the foreign key constraint to the Employee table, since our new database doesn’t contain a table with that name. Also, SQL Azure does not support the CONTENT keyword, so we will remove that as well. Modifying the CREATE statement in a DatabaseSpy SQL Editor window After making sure the Properties window for the revised CREATE statement points to the SQL Azure database, we can execute the statement. When we refresh the database and expand our view in the Online Browser helper window, we can see the new empty table. New table viewed in the DatabaseSpy Online Browser window A data comparison between the existing table and the new one will allow us to create a script to migrate data into our new table in the SQL Azure cloud. This is similar to the data comparison we wrote about in our previous post on SQL Azure, except instead of merging data directly, we will save the merge script. DatabaseSpy Merge Data dialog Our first attempt to run the merger script failed, throwing an error message that SQL Azure cannot insert values into the new table when IDENTITY_INSERT is set to OFF. We can add a line to the merge script to SET INDENTITY_INSERT ON and re-execute: Merge data script viewed in a DatabaseSpy SQL Editor window Next, we can run a SELECT query to view the data that was successfully uploaded. Select query and Results viewed in DatabaseSpy The DatabaseSpy Data Inspector window lets us more easily examine the contents of a wide column, and is ideal to use for XML documents stored in the Resume column of the new JobCandidate table. DatabaseSpy Data Inspector window Editing XML Data with XMLSpy If you need to revise, edit, update, or validate XML data in a SQL Azure database, Altova XMLSpy provides more robust XML editing features than DatabaseSpy. We can connect to our SQL Azure database from XMLSpy and run a SELECT query from the XMLSpy Database Query window. XMLSpy lets us open any XML row for direct editing, with access to advanced XML editing functionality. XMLSpy Database Query view of XML data in the SQL Azure cloud Of course all the familiar features of the XMLSpy text view and grid view are available. XMLSpy Text view of XML data in the SQL Azure cloud XMLSpy Grid view of XML data inthe SQL Azure cloud After your edits are complete, the XMLSpy File / Save menu option saves the revised XML document to the same row of the JobCandidate table in the SQL Azure database in the cloud. XMLSpy File / Save menu option saves XML data to the SQL Azure cloud Parsing XML Data with XQuery You can also apply the XMLSpy XQuery editor, with its built-in knowledge of XQuery syntax and context-sensitive entry helpers to build XQuery statements that parse the XML data in your SQL Azure database. The XQuery statement below extracts and returns the home addresses from the XML resumes where JobCandidateID is less than 7. XMLSpy XQuery editor for XML data in SQL Azure The XQuery statement can be executed in the Database Query window, with results immediately available to work with in XMLSpy. XQuery statement and results inthe XMLSpy Database Query window Of course the XQuery result can also be edited in Text view or in Grid view. XQuery result in XMLSpy Text view XQuery result in XMLSpy Grid view And you can save the query result either from the Database Query window or from the XML Editor view. Find out for yourself how productive you can be by using Altova tools to work with XML data in the SQL Azure cloud ̶ download a free 30-day trial of the Altova MissionKit for Software Architects, an integrated suite that includes XMLSpy, DatabaseSpy, and additional XML, database, and UML tools.

Tags: , , , , , , ,

Connecting DatabaseSpy to a SQL Azure Database in the Cloud


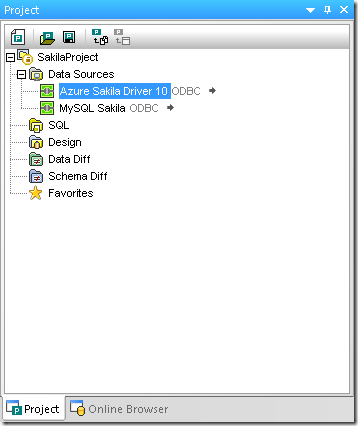
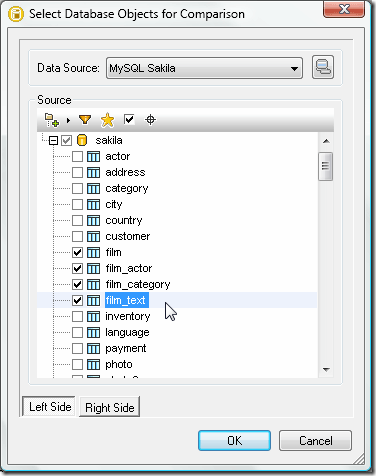
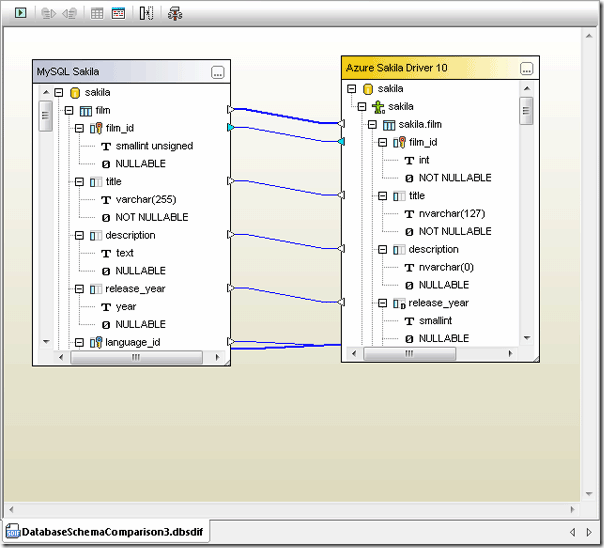
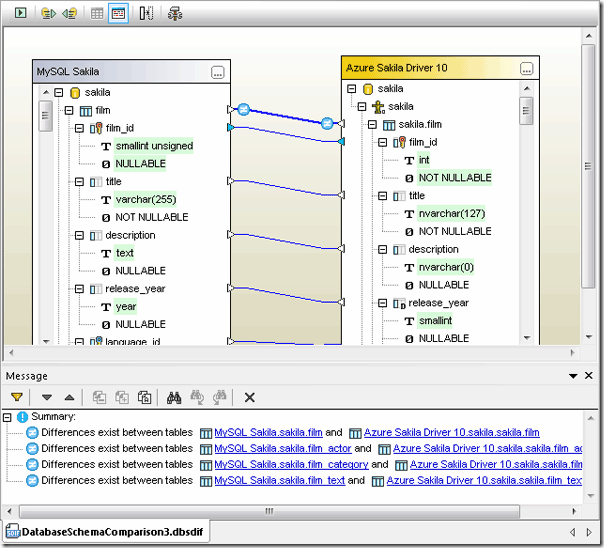
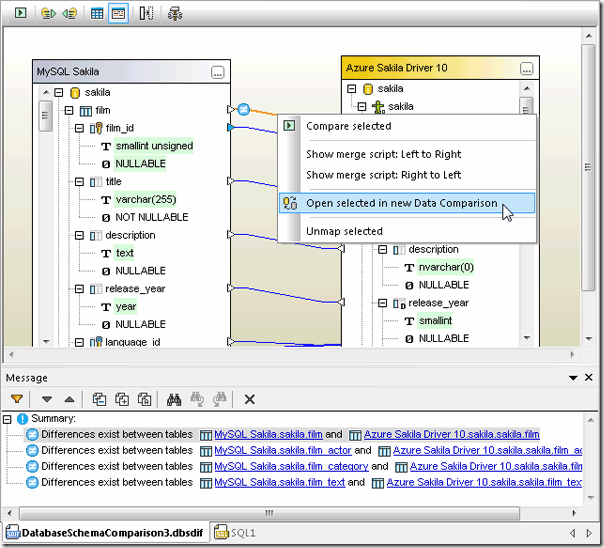
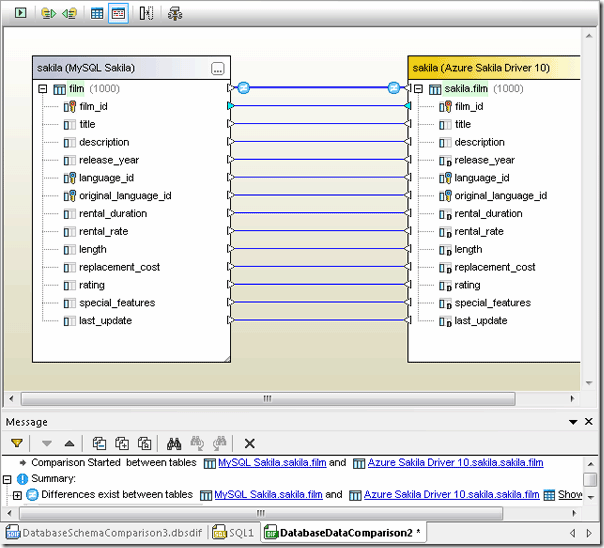
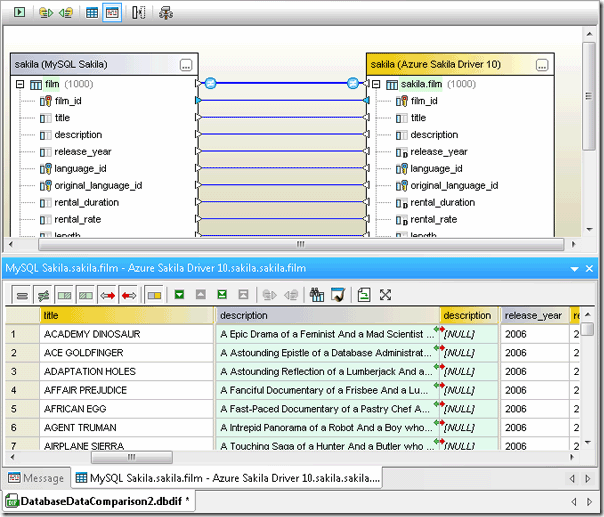
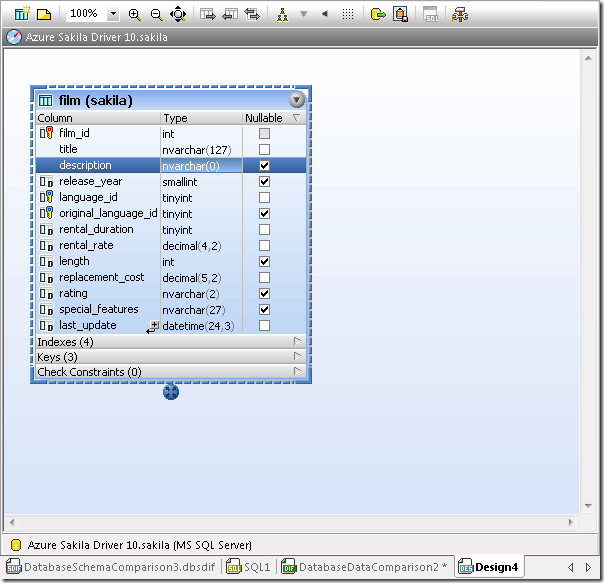
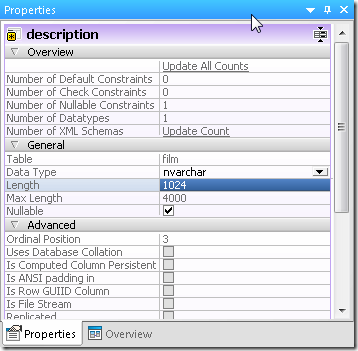
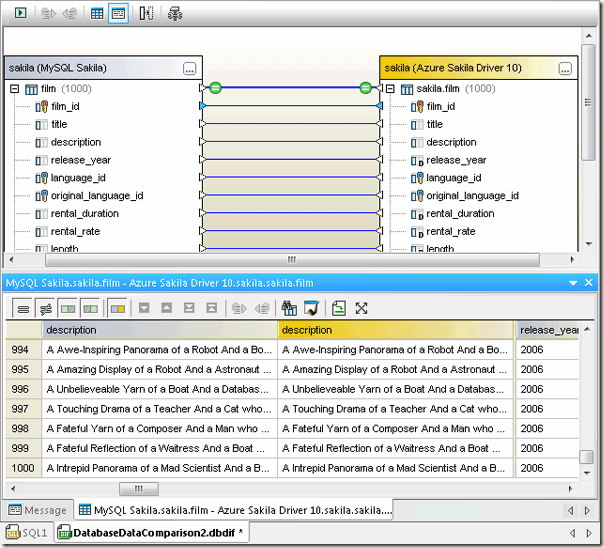
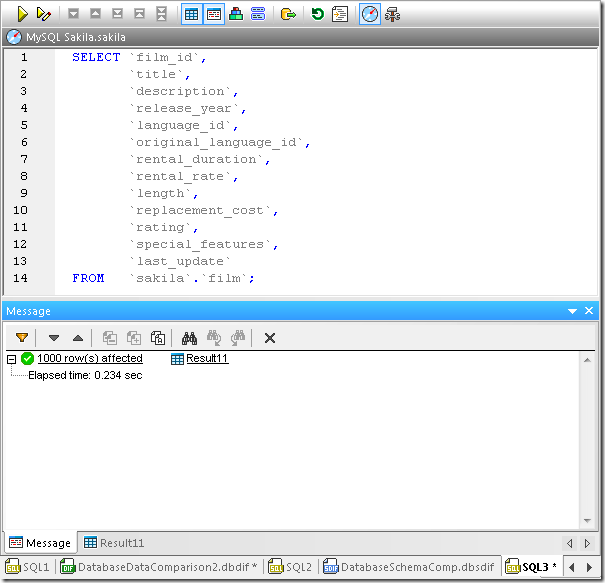
Tips and techniques to ease introduction of Microsoft’s cloud-based SQL Azure database into production environments led the topics in June at the Tech-Ed conference in New Orleans. SQL Azure is built on Microsoft SQL Server technologies and is designed to provide a highly-available and scalable database service hosted by Microsoft in the cloud. Developers who deploy databases in SQL Azure do not have to install, setup, patch, or manage any relational database software, only their own database structure and content. Automatic redundancy and fault tolerance are built-in and no physical administration is required. You can build a manual connection string and use SQL Server syntax and datatypes to connect DatabaseSpy and other Altova tools to SQL Azure databases to perform typical database development and maintenance tasks. This blog post makes a connection to a SQL Azure database from DatabaseSpy and demonstrates several typical operations you might want to perform as you migrate an existing database to the cloud. To retrace these steps on your own you will need a SQL Azure account, or a login and password created by a SQL Azure account holder. For more information on setting up a SQL Azure account, visit the Microsoft SQL Azure home page. You will also need to install the SQL Server Native Client 10.0 (or later). SQL Azure does not behave exactly like a local SQL Server database, so we can’t use the Altova SQL Server connection wizard. Instead we will use an ODBC connection. DatabaseSpy ODBC Connection Dialog We won’t illustrate all the details of the process of building a new connection string here. You can paste an existing connection string into the dialog shown above, or, if you need specific instructions for each step to manually create a new string, you can refer to the Tech Note titled Build an ODBC Connection String for SQL Azure on the Altova Web site. After you connect to SQL Azure the first time, a DatabaseSpy project file lets you save all your connection settings along with frequently-used SQL scripts, database design files, and database comparisons in a convenient bundle to reload later. The screenshot below shows a new DatabaseSpy project with two databases connected simultaneously, Sakila in MySQL and Sakila in the cloud in SQL Azure. DatabaseSpy Project Helper Window Microsoft provides a number of conversion tools to help users migrate existing databases to the SQL Azure platform. We used the Microsoft SQL Server Migration Assistant for MySQL to convert our local MySQL Sakila sample database to our SQL Azure account. DatabasesSpy lets users open multiple connections simultaneously, even to databases of different types. The database comparison functionality of DatabaseSpy makes it an ideal tool to check the results of the Sakila conversion. First we will open a database schema comparison and select a few tables from the MySQL database for the left side of the comparison. DatabaseSpy Comparison Selection Dialog After we select the corresponding tables from SQL Azure version, the tables open in a database schema comparison window. DatabaseSpy Schema Comparison When we click the green compare button at the top left corner of the window, DatabaseSpy compares the database structures, highlights differences, and generates a summary in the message window. DatabaseSpy Schema Comparison with Differences Some differences represent datatype definitions that vary between databases. For instance, the MySQL type unsigned small int does not have an exact equivalent in SQL Server, so the conversion tool substituted the int type for the film_id column in the film table. Also, the year datatype assigned to the release_year column in MySQL has been converted to a smallint in SQL Azure. I guess this will make the SQL Azure version of the database more forward-compatible, since it will be able to accommodate films released all the way through the year 32,767, as opposed to 2155, which is the maximum value of the year datatype in MySQL! We can compare data contained in the two databases via a selection in the right-click context menu, opening the selected tables in a new data comparison window. DatabaseSpy Comparison Context Menu The data comparison shows us the contents of the tables are not identical. DatabaseSpy Content Comparison When we open the results window, we see that the description column did not migrate successfully. DatabaseSpy Content Comparison with Results Looking back at the Database Schema Comparison window, we can see the length of the description column was set to zero. This explains the red arrows that point from the description column in MySQL to the description column in SQL Azure in the Results window. We cannot copy any string of text into a column with a defined length of zero. Instead, let’s open the SQL Azure version of the film table in a new Design window. DatabaseSpy Graphical Design View We can increase the size of the description field in the Properties window, and run the resulting change script. DatabaseSpy Graphical Design Properties Helper Window DatabaseSpy Database Structure Change Script Next, when we re-run the data comparison, we find that the data was converted, but the previously defined field length of zero made the data invisible. DatabaseSpy Content Comparison with Results Latency Issues You can use DatabaseSpy to explore latency issues for the cloud database vs. the local copy. We saw from the data comparison above that the film tables in the two databases contain 1,000 rows of identical data. We can repeatedly run SELECT statements to retrieve the data from SQL Azure and from the local MySQL database to time the results. The DatabaseSpy SQL Editor message window displays the execution time. SQL Azure Query Execution Time Running the above SELECT statement five consecutive times on the SQL Azure version of the sakila database generated results ranging from 60.632 seconds to 63.851 seconds. Running a SELECT statement for the same film table in the local MySQL database yielded the following result: SQL Server Query Execution Time Repeating the test for the local version generated similar times. The takeaway for developers is your database-driven application will likely need to accommodate latency as you move your data to the cloud. Try your own connection to SQL Azure with a free trial of Altova DatabaseSpy.

Tags: , , ,

Working with XML in Databases


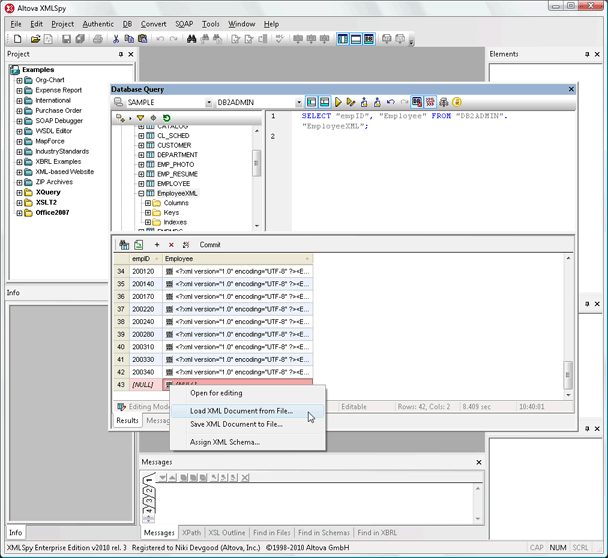
More and more users are storing XML documents in database columns, especially when XML data is sent or received from other entities. Storing data in XML helps enterprises more easily accommodate revisions to industry-standard data formats as XML Schemas evolve over time. One challenge in migrating from a relational database to an XML-oriented database application is developing queries that replace traditional SQL queries of relational data to parse XML documents stored in the database. We recently had an opportunity to address XQuery for XML in databases in a presentation titled Altova Tools for DB2® in a teleconference sponsored by IBM® for the pureXML™ Devotees user group. After an introduction and brief background on Altova, we focused on the special functionality included in XMLSpy to manage XML Schemas in DB2 and to edit XML data stored in DB2. The XMLSpy Database Query Window makes it easy to edit XML database content directly in XMLSpy. XMLSpy_editDB2_blog Altova has built specialized capabilities for deep integration of Altova tools with the DB2 pureXML data server to help customers working with XML, XML Schema, XQuery, and other XML-related technologies. We demonstrated the XMLSpy XQuery editor, XQuery debugger and XQuery profiler, with support for executing XQuery scripts directly against the DB2 database and for the special DB2 xmlcolumn and sqlquery operators. We closed the presentation with a walk-through of the steps a user can take to migrate legacy relational data to an XML-based application, including inferring an XML Schema from relational data in a table in DB2, then importing data from the table and automatically tagging it in XML according to the new XML Schema. We have uploaded a PDF file the slides from the presentation on SlideShare. You can also get a copy at the IBM pureXML Devotees page, where you can listen to the recorded audio as well. The best way to experience for yourself how well the features of XMLSpy, MapForce, StyleVision, and DatabaseSpy work with DB2 and other databases with XML is to click here to download a free trial of the Altova MissionKit.

Tags: , , , , , , ,

Altova at Microsoft PDC


clip_image001The Altova road trip continues as we head west to Microsoft PDC in Los Angeles from November 17-19 at the Los Angeles Convention Center. If you’ll be attending PDC, make sure to stop by and meet with the Altova team at booth 517. We’ll be demonstrating all the Most Wanted features of Version 2010, our latest software release that includes XBRL enhancements in XMLSpy, support for WSDL 2.0 in XMLSpy and MapForce, a new absolute positioning design paradigm in StyleVision, database schema conversion in DatabaseSpy, and much more. With the new emphasis on software modeling in Microsoft development tools, you’ll want to check out SysML and all the other new functionality in UModel 2010. We love L.A., but if you’re not going to PDC this year, be sure to check the Altova blog again later for updates about the event and more details about Version 2010.

Tags: , , , , , , , , , , ,

What to Do On a Rainy Day in San Francisco?


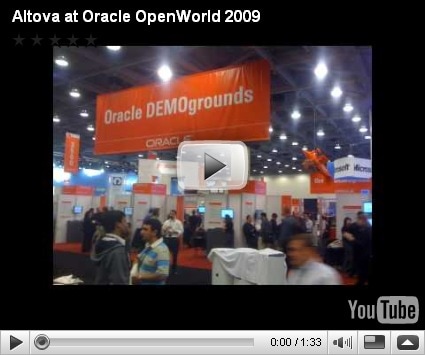
That was the question for 30,000-plus attendees at Oracle OpenWorld 2009 last week, when weather forecasters were predicting the remnants of a Pacific typhoon would hit San Francisco with winds up to 60 miles per hour and drop rainfall measuring multiple inches. A rainy day in San Francisco Fortunately, the best attractions were all indoors. Oracle OpenWorld is one of the largest events held each year at the Moscone Convention Center. The keynote speeches, conference seminars, and partner exhibitions fill all three buildings. Even Howard Street between the North and South halls is closed for an entire block to create room for the lunch pavilion. Oracle OpenWorld is the best place to come for face-to-face education and interaction on all subjects related to every facet of the Oracle ecosystem. Altova is an Oracle Partner and this is an event we look forward to every year. The Altova MissionKit provides extensive support for database management, query, and design; database integration; database differencing; and database content editing. Altova at Oracle OpenWorld We love to meet users whose Oracle databases contain XML and show off features like support for Oracle XML DB data modeling, and the XQuery editor, debugger, and profiler in XMLSpy. We love to talk to users whose Oracle databases don’t contain XML yet, so we can demonstrate how to derive an XML Schema from the tables and relationships in a non-XML database. We also like to meet users who sometimes interact with databases other than Oracle, since the database functionality in Altova tools is never restricted to a single database technology. Due to the Oracle acquisition of Sun this year, MySQL was a popular subject. Our DatabaseSpy demo in the Altova booth highlighted simultaneous connections to Oracle and MySQL databases with interactive functionality to compare and merge data between tables in different database types. With convenient shuttle service from all the area hotels to Moscone, the question became not “What to do in the rain?”, but “What to do first?” Conference sessions covered every topic from databases to applications, to middleware, to specialized industry topics, and even XBRL. In Moscone West the Oracle Demo Grounds were always busy, with dozens of individual stations simultaneously active. The Altova booth was a popular spot, as were displays by other Oracle partners, including Amazon, Salesforce, and many more. To refresh and recharge, there were lots of fun things to do too. We even saw evidence that Paul and Ringo might have been there. They left their instruments Best yet, when we stepped outside after a long, productive day, the rain had stopped and we were presented with a warm San Francisco night. Check out our Oracle Openworld 2009 video slideshow on YouTube to see more:

Tags: , , , , , , ,

NYC & Company Case Study


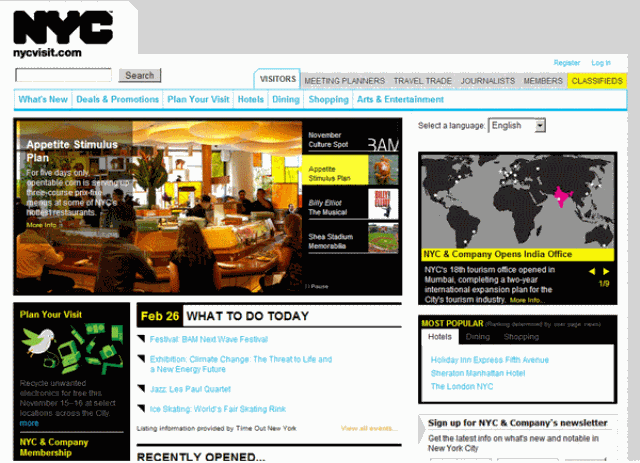
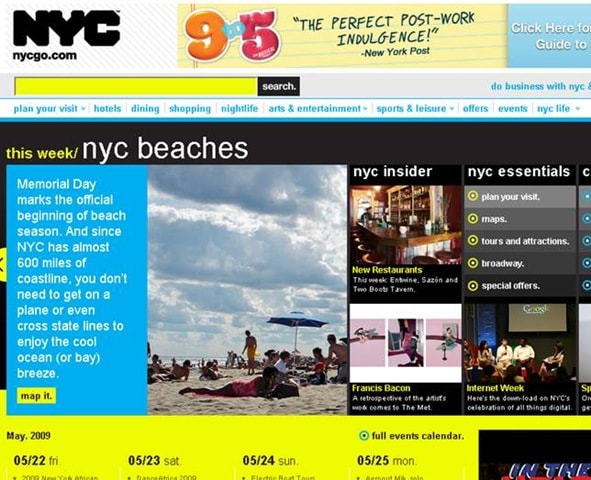
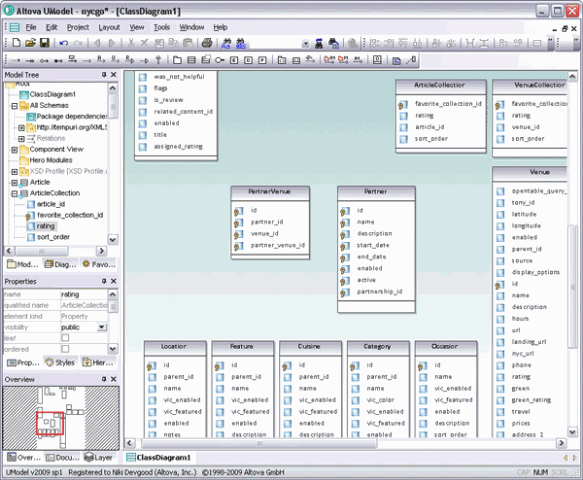
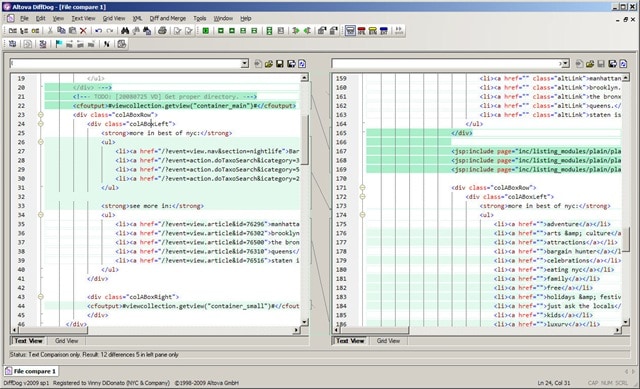
Overview NYC & Company is the official marketing, tourism and partnership organization for the five boroughs of New York City. Its mission is to maximize travel and tourism opportunities, build economic prosperity, and spread the dynamic image of New York City around the world. In 2008-2009, the company initiated a major rebranding, redefining their Web presence and launching an interactive multi-media center in Midtown Manhattan. At the center of this transformation, NYC & Company used development tools from the Altova MissionKit – UModel, DiffDog, DatabaseSpy, and XMLSpy. The NYC & Company Web site and Information Center was created together with online powerhouses as Google and Travelocity, reservation sites like Open Table, content providers Time Out, Greenopia.com, the New York City Department of Cultural Affairs, and more. The Challenge As the single organization responsible for meeting the marketing and tourism needs of the city of New York, NYC & Company has been tasked with meeting Mayor Bloomberg’s January 2006 State of the City goal of luring 50 million visitors by the year 2015 – up from an estimated 43 million in 2006. A large part of the effort behind this push would be manifested in a general Web site rebrand/redesign coupled with the creation of an interactive visitor center. NYC & Company chose to use existing tools and technologies as much as possible, leveraging their ColdFusion Web site architecture, the Eclipse software development platform, a SQL Server 2005 backend, and the Altova MissionKit. A new content management system was also implemented to manage the large amounts of data and associated workflow. The Solution The NYC & Company Web site redesign included a migration from nycvisit.com, which followed a typical convention and visitor bureau site structure, to the much more animated and multi-faceted nycgo.com, a design that promotes the dynamic nature of the resources available and of the city itself. clip_image001 nycvisit.com on 26 February 2008 clip_image003 nycgo.com on 22 May 2009 UML Modeling The new design components were drawn out as a UML class diagram, expanding on the data model that was created for the live Web site. NYC & Company used Altova UModel to map out the physical structure of nycgo.com, importing their XML Schema definition to ensure adherence to formatting rules. The class diagram was used to represent the new Web site structure at a high level, and to model the objects that needed to be built into NYC & Company’s content management system (CMS). UML design in UModel also enabled the company to generate documentation so that the developers could share the UI design with those not familiar with the intricacies of UML. clip_image004 UModel UML Class Diagram of the nycgo Web site NYC & Company then worked with third party design vendor, HUGE, Inc., to further analyze the UML wire frames and predict user interaction scenarios for the nycgo Web site. Dynamic code was then delivered in JSP, implemented on JRun then subsequently converted to ColdFusion. Code Differencing NYC & Company chose to migrate their JSP templates to ColdFusion 8 for its rapid application development capabilities, rich feature set, and intrinsic simplicity. DiffDog, Altova’s diff/merge tool, was an integral part of the development process, helping the development team to ensure that the ColdFusion code was in line with the original JSP. NYC & Company could easily recognize and reconcile any crucial differences using DiffDog’s straightforward text comparison interface. diffdog2 JSP/CFM code differencing in DiffDog Database Migration As part of their rebranding effort, NYC & Company successfully migrated their data from SQL Server 2000 to SQL Server 2005. NYC & Company used Altova DatabaseSpy to connect to the database, structure queries, and for database analysis. They also use the integrated SQL Editor to test their more complex SQL queries. This enabled them to do their database management and testing in-house, with non-technical and even non-DBA team members assembling complex SQL scripts with features such as auto-completion, syntax color coding, automatic formatting, and refactoring. Building Out the Content Management System NYC & Company used a third party CMS to manage workflow and collaboration for newly designed the Web site. The CMS was also modified to output XML feeds. Additionally, content sourced from NYC & Company’s partners was validated against an XML Schema and then imported into the CMS. Every night, a scheduled task is initiated that delivers the formatted XML feeds to the interactive data center. XMLSpy, Altova’s XML editor, provides NYC & Company with all of its XML editing needs – from validating and saving content, to managing and manipulating it as part of an integrated workflow. Real-time XML Feeds The XML feeds that are available on the nycgo Web site, and the interactive wall kiosks and tables at the Information Center are taken from data submitted by NYC & Company’s numerous content partners and provide real-time information about attractions and events all around the city. Once accessed, the information can be transferred to any mobile device via SMS. The walls display touch-screen FAQ stations that inform visitors about top New York City attractions and provide other useful information like how to tip a doorman, places to exchange currency, etc. in English and nine other languages. Users can also buy MetroCards and tickets to exhibits and other popular events. ONIC-launch-007 The same real-time data is also fed to interactive tables, where visitors place a “puck” on a Google map of the city to select their area of interest. They then click on a category (e.g., dining, entertainment, etc.) to get more information. clip_image010 The Results NYC & Company offers the latest in travel and tourism to New York City’s visitors, which number well over 40 million in any given year and offers a wealth of new experiences and up-to-date information to adventurous locals. The innovative new Web site design and interactive exploration center pulls together the latest in hardware, software, and data management technologies to showcase every aspect of this multi-faceted city to tourists from all walks of life and with all sorts of interests. NYC & Company was able to leverage the Altova MissionKit to manage large amounts of disparate data from a variety of different sources -from the preliminary UML modeling, to code differencing, database management, and XML editing. Find out how the Altova MissionKit can help with the end-to-end management of all of your data assets. Download a fully functional free trial of the Altova MissionKit today!

Tags: , , , , , ,

Altova Tools for IT Professionals – Tell Us Your Story


MissionKit XMLSpy and the other tools in the Altova MissionKit are well-known in the development community as the go-to toolset for XML, data integration, UML, and database development projects. But Altova tools are also used by IT professionals to efficiently complete a variety of enterprise support tasks: XMLSpy is an advanced tool that makes XML documents easy to navigate and edit. Do you use XMLSpy to edit or validate any of the wide variety of XML configuration and data files increasingly essential to today’s IT environments? MapForce integrates and maps data between any combination of XML, databases, flat files, EDI, Excel 2007, XBRL, and/or Web Services. Have you ever used MapForce to merge an end-user’s Excel data into a database? DatabaseSpy is the unique multi-database query, design, content editor, and comparison tool selected as Roundup Champion by Redmond Magazine. Have you used DatabaseSpy to browse an unfamiliar database or build a SQL query to get a quick answer? And who could forget DiffDog? At every trade show visitors come to the Altova booth to rave about Altova’s file, folder, and database diff/merge tool. Do you depend on DiffDog to quickly identify changes between the live instance of a mission-critical file or folder and a backup copy? If you’re an IT professional who uses Altova tools to support the technical infrastructure of your enterprise, we’d like to hear your story. Click here to visit the Altova Case Studies page and check out the right margin to contact us. Of course you can comment right here too!
Tags: , , , , , ,

Altova at Microsoft Tech Ed 2009


If you missed Microsoft Tech Ed in Los Angeles last week, check out our latest YouTube video for a quick trip to catch up on some of the sights and sounds of the Partner Exhibition. Our team on the scene reported a strong positive response to the XBRL and HL7 functionality in Version 2009 of the Altova MissionKit and many shout-outs from the floor for individual Altova tools — XMLSpy, MapForce, StyleVision, and UModel are all popular in the developer community. IT professionals commonly use DatabaseSpy and DiffDog to efficiently complete everyday database and differencing tasks.

  You can also see a video clip reporting on Altova at Tech Ed at the TechTarget site. Check out the Altova Events page to follow our upcoming show schedule and see where you can meet us live!

Tags: , , , , , , , , , , , , ,

New DatabaseSpy Video: Exploring Databases


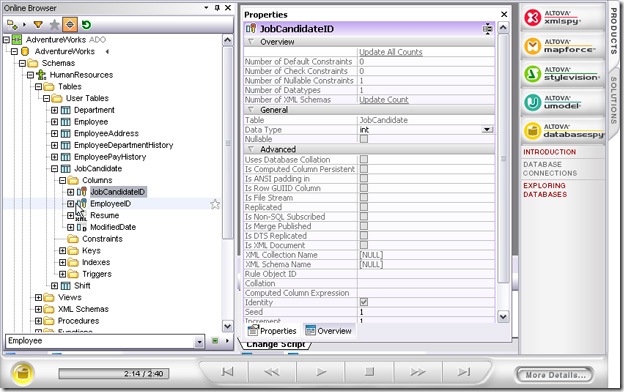
We’ve just launched the third video in the DatabaseSpy series. Exploring Databases is a tour of the DatabaseSpy Online Browser, a powerful tool for viewing, searching, and analyzing one or more connected databases. Exploring Databases demo Exploring Databases builds on the preceding video, Database Connections, which demonstrated how easy it is to use DatabaseSpy to connect to one or more databases. You can even simultaneously connect to databases of different types. And DatabaseSpy supports the most popular databases in production today, including Microsoft SQL Server, IBM DB2, Oracle, Sybase, MySQL, and more. Once you’re connected, the DatabaseSpy Online Browser shows you an expandable hierarchy of the database structure. It’s a great place to start exploring an unfamiliar database or quickly navigate to any specific element you need to work with in a familiar one. The Altova Flash videos are proving to be a popular feature on our Web site, with close to 350,000 views in all. If you haven’t seen an Altova product video yet, you’re missing a great opportunity to get a flavor for components of the award-winning Altova MissionKit by seeing them in action. If you’re already a fan, check back again soon — we’re in the studio working on more videos right now.

Tags: , , , , , , ,

Now available: Altova MissionKit Version 2009


We are very excited to announce general availability of the Altova MissionKit 2009 suite of XML, database, and UML tools. Version 2009 delivers numerous new features across the tools included in the MissionKit, including comprehensive support for working with XBRL, native support for new databases and database differencing, UML sequence diagram generation, and much more. A few details are below, with complete information and screenshots available on the Altova What’s New page. Coinciding with this major release, we have decided to pass savings realized due to the currently favorable US$/EUR exchange rate directly to our customers by reducing US$ prices across the entire Version 2009 product line.

Support for XBRL

The Altova MissionKit 2009 provides powerful new support for viewing, editing, validating, mapping, and publishing XBRL data. With intelligent wizards, graphical drag-and-drop design models, and various code generation capabilities, the MissionKit Version 2009 gives developers, technical professionals, and power users one easy-to-use suite of tools for working with XBRL and transforming data into content that can be shared with business partners, stakeholders, and regulatory commissions. Altova MissionKit tools with XBRL support are:

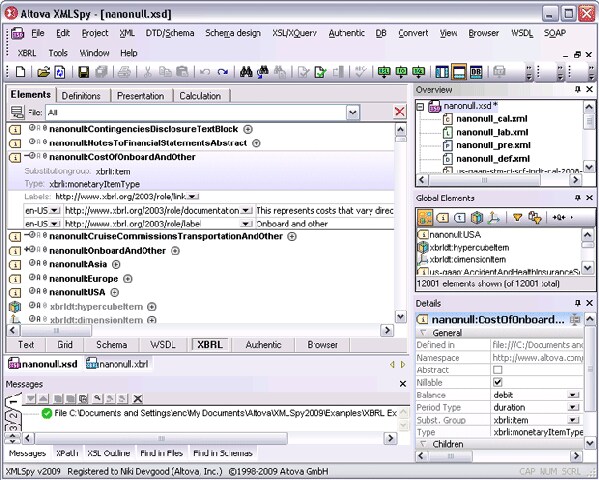
  • XMLSpy 2009 – includes an XBRL validation engine that allows users to view and analyze XBRL taxonomies, as well as validate XBRL instance documents. XMLSpy 2009 also includes a graphical XBRL taxonomy editor, which provides a visual representation of XBRL taxonomies with intelligent views and entry helpers for editing and extending them.

XBRL-taxonomy-editor2

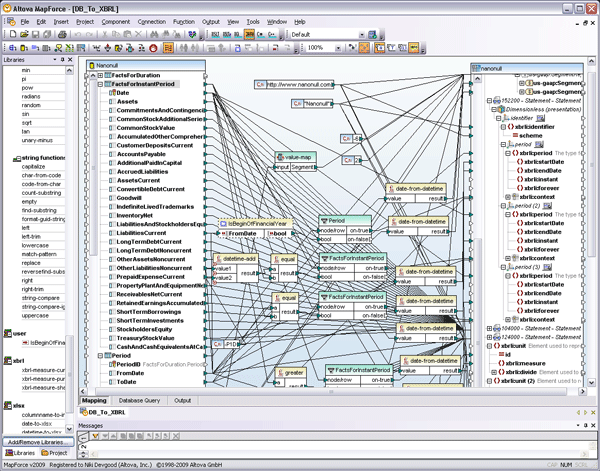
  • MapForce 2009 – supports graphical, drag-and-drop mapping of XBRL taxonomies as the source or target in any data mapping project. This new functionality enables users to comply with financial and business reporting mandates by graphically mapping backend data from accounting systems and databases to the XBRL format, or creating valid interim reports based on stored data. Users can map XBRL data to or from any other data format supported by MapForce, including XML, databases, flat files, Excel 2007 (OOXML), Web services, and EDI. This support is also useful for aggregating public XBRL data and mapping it to a database, for instance, for further analysis.
mapforce_xbrl_thumb

  • StyleVision 2009 – Altova’s graphical stylesheet design tool now includes support for rendering XBRL data. This allows users to visually design financial reports for simultaneous output into HTML, RTF, PDF, and Word 2007 (OOXML) formats, enabling organizations to share customized business data in online or print format(s) with business partners, stakeholders, and regulatory commissions, all based on XBRL taxonomy requirements. 

Extended Database Functionality

Native support for additional databases has been added to all database-enabled Altova MissionKit tools, including XMLSpy 2009, MapForce 2009, DatabaseSpy 2009, StyleVision 2009, and DiffDog 2009. Current support for SQL Server® and Oracle® databases is now extended to include the most recent versions – SQL Server 2008 and Oracle 11g. New support for the PostgreSQL 8 database is also now available. In addition, both DatabaseSpy 2009 and DiffDog 2009 now allow you to compare and merge database content. Individual database tables or multiple tables within a schema can be compared, whether they are the same database type or completely different databases. Results of the content comparisons are displayed in tables, and differences can be merged bi-directionally. This new database comparison functionality allows users to easily backup, copy, or merge data quickly and easily. WhatsNewV2009DatabaseSpy2_thumb

Sequence Diagram Generation

MissionKit users working with UML will be especially interested in this new functionality in UModel 2009. Sequence diagram generation greatly assists developers who need to reverse engineer existing applications written in Java, C#, or Visual Basic. After importing an existing project, directory, or file into a UModel 2009 project, you can now select any operation in any class, and automatically generate a sequence diagram that illustrates the lifecycle of the operation, as well as objects that interact with it. Like all other project diagrams in UModel, sequence diagrams are stored as part of the UModel project file and can be included in generated UModel project documentation.   Check out the full list of features added in Version 2009, and be sure to check back here frequently, as we’ll be blogging about more new features each week. As always, you can download a free trial of the Altova MissionKit to test out this new functionality for yourself.
Tags: , , , , , , , , ,

Altova MissionKit and DatabaseSpy Named Jolt Award Finalists


JOLT We received an exciting piece of news that brightened a cold winter day when snow was in the forecast: The Altova MissionKit has been selected as a finalist for the 2009 Jolt Award in the Development Environment category. And it gets even better: Altova DatabaseSpy as a standalone application has also been selected as a Jolt Award finalist in the Database Engines and Data Tools category. The 19th Annual Jolt Award winners will be announced at the SD West Conference in Santa Clara, CA in March, 2009. The Jolt Awards are designed to “recognize the most innovative, trend-making, ahead of the curve products,” according to Dr. Dobb’s, the award sponsor. Even before the winners are announced, it’s an honor to be selected as a Jolt Award finalist, since the judges select five finalists in each category from the literally hundreds of development tools and apps available in today’s fast-moving marketplace. The judges are all noted software industry leaders with experience across a wide range of development technologies and projects. We’re pleased that Altova continues to be recognized in such acclaimed company. XMLSpy was a 2003 Jolt Award winner in the Languages and Development Environments category, MapForce was a 2004 Jolt Award winner in the Business Integration and Data Tools category, and UModel was a 2006 Jolt Award finalist in the Design Tools and Modeling category. You can see the entire list of this year’s Jolt finalists at http://www.joltawards.com/finalists.html.

Tags: , ,

New Demo Video: Intro to DatabaseSpy


We’re expanding our Flash video series to cover DatabaseSpy, Altova’s multi-purpose database utility. Available to view now, the first DatabaseSpy video is a two-minute introduction that quickly highlights many DatabaseSpy features and shows off its elegant and fun-to-use interface. Database tool demo If you have ever wondered how a multi-database query and design tool can help with a range of database analysis, design, and editing tasks, check out this quick tour. You’ll get to see the DatabaseSpy Quick Connection Wizard, Database Browser, SQL Editor, data editing functionality, and the Graphical Design Editor that lets you visualize, create, or modify database tables and relationships without writing SQL commands. Find out for yourself why DatabaseSpy has received such high acclaim – and look for more Flash videos coming soon in the DatabaseSpy series!

Tags: , , ,

Oracle OpenWorld 2008 recap


The Altova team exhibited at Oracle OpenWorld 2008 in San Francisco last week. The exhibit halls were packed, and we were happy to have a steady stream of visitors to our booth. We had the pleasure of talking with many Altova customers as well as other Oracle users and developers interested in Altova XML, database, and UML tools. Of particular interest with this crowd were MapForce and DatabaseSpy, but we talked with lots of folks whose challenges – from publishing XML and database data, to UML modeling, to Web services testing – could be met with other tools across the Altova product line. We also had the opportunity to introduce many visitors to the Altova MissionKit, and people were happy to hear that they could get a full suite of tools and save some money at the same time. Here are a few videos chronicling our trip, including some on-the-spot product demos. The first is a 1-minute bird’s eye tour of downtown San Francisco and the Altova booth in the Moscone West exhibition hall.

Here we learn how to efficiently migrate legacy relational data to a 21st-century XML application using XMLSpy. Bonus Scene: a water feature to improve your Feng Shui.

Finally, this video includes a demo of DatabaseSpy, featuring how to use the Graphical Database Design editor to explore and modify database tables. Bonus Scene: take a ride on a San Francisco cable car!

These were shot live on the floor of the exhibition, as you’ll hear from the enthusiastic crowds in the background, and at other spots around town. Whether you attended the show this year or not, we hope you’ll enjoy our video postcards. Altova’s next exhibit will be at Microsoft PDC in Las Vegas – we hope to see you there!

Tags: , , , , , ,

Editing Database Views and Stored Procedures


“Ninety percent of the time you just need to make a simple modification,” the Redmond Magazine reviewer wrote in the introduction to the recent review that selected DatabaseSpy as Redmond Roundup Champion among database tools. DatabaseSpy lets you make those quick updates with its intuitive interface that is consistent across multiple database types. For the other ten percent of the time, DatabaseSpy can also be an appropriate tool for more advanced database maintenance tasks, such as creating or altering database views and stored procedures. Let’s take a look . . . The DatabaseSpy 2008 Online Browser lets you explore views and procedures by navigating and expanding them the same way you can explore tables in the hierarchical display of the Online Browser helper window. DatabaseSpy edit views and stored procedures

Edit Database Views

When you select an existing database view in the Online Browser window, the right-click context menu offers options to generate new statements in the SQL Editor that can quickly get you started editing a view, or to assist creating a new one. DatabaseSpy edit views and stored procedures For instance, when you generate a create statement for an existing view, DatabaseSpy displays the formatted and color-coded view definition for immediate access in a new SQL Editor window. DatabaseSpy edit views and stored procedures

Create a New Database View

You can modify the statement any way you like in the SQL Editor. As an example, let’s assume you’ve been assigned to create a company phone directory view. All the data you need is already contained in the employees view – plus a lot more! You can start by saving a copy of the employee view with a new name. Simply edit the database view name, execute your statement, and the new database view is created. DatabaseSpy edit views and stored procedures As you refresh the database connection in the Online Browser window, the new view is immediately visible and available for access. DatabaseSpy edit views and stored procedures

Alter a Database View

You can choose the Alter selection from the right-click context menu to edit any database view, including the new phone directory view. You can revise the existing view to make the changes you want, taking advantage of all the DatabaseSpy SQL Editor functionality, including color coding, automatic formatting, and even auto-completion. DatabaseSpy edit views and stored procedures When your edits are complete, the SQL Editor Execute button runs the alter statement and modifies the view in the database. DatabaseSpy edit views and stored procedures To make access to the new phone directory view even easier for the HR department, you can save a select statement for the view in a SQL file and add it to the HR manager’s DatabaseSpy Project menu. Altova DatabaseSpy edit views and stored procedures

Use SQL Refactoring to Create a View

If you don’t have an existing view to use as a template, DatabaseSpy 2008 offers a convenient alternative. The SQL Refactoring menu includes an option to convert any select query to a create view statement. The default view name is even highlighted so you can immediately assign a more relevant name. Altova DatabaseSpy edit views and stored procedures
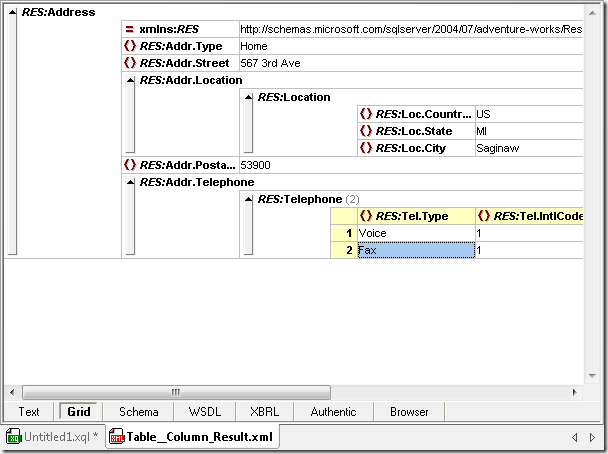
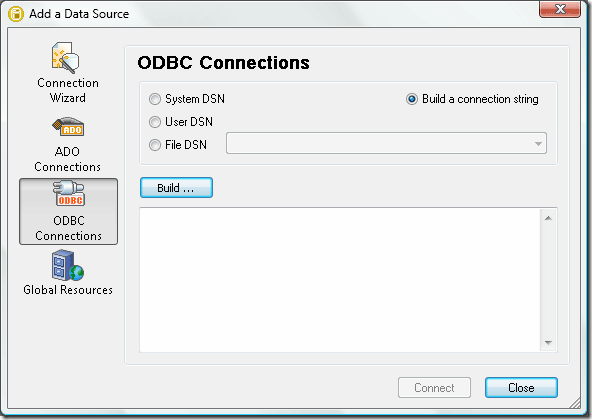
DatabaseSpy edit views and stored procedures

Edit Stored Procedures

The DatabaseSpy 2008 Online Browser also lets you edit stored procedures in your database. You can highlight any stored procedure, then can expand your selection to explore it. Or, use the right-click context menu to generate SQL statements for operations available to act on stored procedures. Altova DatabaseSpy edit views and stored procedures
You can edit stored procedures in the DatabaseSpy SQL Editor, and execute your revised statements using the same techniques described above for database views. DatabaseSpy edit views and stored procedures DatabaseSpy edit views and stored procedures

Execute Stored Procedures

The Execute option in the DatabaseSpy 2008 context menu for stored procedures builds a time-saving template for an execution script for the stored procedure. Altova DatabaseSpy edit views and stored procedures
For procedures that require parameters, all you have to do is set the parameter values, then it’s just one click to execute the stored procedure and view the results. Altova DatabaseSpy edit views and stored procedures

Edit User-defined Functions

DatabaseSpy 2008 even lets you navigate and edit user-defined functions stored in your database, starting from the same convenient right-click context menu in the Online Browser. Altova DatabaseSpy edit views and stored procedures Try this for yourself with a free trial of Altova DatabaseSpy.

Tags: ,

Redmond Roundup: Tooling Around in Your Database


RedmondMag.com just published a great article by Peter Varhol, a principal at Technology Strategy Research LLC, an industry analysis and consulting firm. This “Redmond Roundup” discusses common database management tasks and reviews some of the tools that are popular in that space:

Sometimes you don’t need a full-fledged database-management environment. Maybe you just need to go in and add a field, change a table or write an ad hoc query. Certainly you can do all those things in the SQL Server administration tools, writing your own SQL at the command line. Unless you’re a SQL expert, though, that process can be lengthy and error-prone. Having a graphical tool that’s easy to learn and use — and one that you don’t have to use every day to remember how to perform simple actions — is much more productive. Simply point it at the database, click the mouse to tell the tool what to do and your database maintenance is done…

Varhol examines three leading database tools and concludes by awarding Altova’s very own DatabaseSpy Redmond Roundup Champion, noting, “DatabaseSpy is the best overall in terms of range of features.” Redmond Roundup Image source: http://redmondmag.com/features/article.asp?editorialsid=2530

Tags: ,

Altova Releases Version 2008 of its Award-winning Software Product Line


Altova, creator of XMLSpy and other leading XML, data management, UML, and Web services tools, today announced the availability of Version 2008 (v2008) of its award-winning line of software development tools. With the release of its v2008 products, Altova introduces a host of powerful new capabilities, including support for the Widows Vista operating system across the product line, extended support for Office Open XML file formats in XMLSpy, more data mapping versatility in MapForce, and enhanced database functionality in StyleVision. Additionally, this new software version brings Visual Basic .NET code engineering and real-time integration with Visual Studio and Eclipse in UModel, support for editing database views and stored procedures in DatabaseSpy, one-click directory synchronization in DiffDog, and much more.

Tags: , , , , , , , , , ,