We’ve reported previously on support for node functions that simplify mapping structured data by eliminating need to copy-paste a function multiple times into a mapping. Repeating the same function unnecessarily clutters the mapping layout and makes the data mapping more difficult to understand or revise.
MapForce also includes additional filters are available for defining node functions. These parameters allow developers to apply functions and default values to specific nodes based on custom-defined criteria. For example, you can apply a node function based on node metadata such as the node name, node length, precision of the node’s data type, customized node annotations, and more.
Let’s look at a mapping with enhanced node functions.
A common requirement in data processing is batch data mapping, especially in the context of data transformation and integration. It involves converting data in batches rather than processing individual data points one at a time. Batch data mapping is often required in data integration scenarios where input from multiple sources needs to be aligned or transformed together. Two common scenarios are “batch to batch” and “batch to one.”
In our latest series of MapForce demo videos, we explore these common data mapping challenges.
BATCH TO BATCH DATA MAPPING
Batch to batch data mapping is helpful in scenarios where you have data updates or changes coming in batches, and you need to synchronize or transform these batches together. This could be to convert them to a different format, perform some type of sort or calculation, or a combination of these.
In this demo, we create a data mapping project that reads files from a directory and uses wildcards to set up a mapping that will process data from multiple files at once. Then, we explore another option for defining batch conversion using dynamic file names supplied by the mapping. This demo also shows how to add calculations and comments to your data mapping projects.
While this video highlights a batch to batch transformation of JSON files to XML files, MapForce supports conversion and transformation for any combination of XML, JSON, PDF, database, text, Protobuf, Excel, XBRL, and so on, for advanced data integration and ETL processes.
BATCH TO ONE DATA TRANSFORMATION
Batch to one data transformation is another common requirement, for example, when you want to merge or combine multiple files into a single consolidated document and perform some data transformation, conversion, or calculation operations in between.
This example also explores multiple approaches to defining the batch process, which will be applicable in different scenarios:
Specifying a collection of files in the same directory using a wildcard
Selecting batch files based on a list of file names stored in a different directory
This demo also shows how to sort the data merged from multiple files before writing it to the target.
After watching these quick demos, you can download a free trial of MapForce to try batch mapping, conversion, and transformation for yourself.
MORE MAPFORCE DEMOS
If you liked these videos, check out the rest of the MapForce demo series, which covers everything from mapping XML and JSON to databases to configuring data processing functions and extracting data from PDF documents.
MapForce, Altova’s award-winning data mapping tool, includes support for PDF input in data integration and ETL workflows. The MapForce PDF Extractor makes it easy to define rules for extracting PDF data in a structured format to make it available for mapping to other popular formats like Excel, XML, JSON, databases, and more.
Version 2024 of Altova Software introduces brand new AI Assistants in multiple products as well as long-awaited support for PDF data integration in MapForce. Other features include Markdown editing support, split output preview for business report creation, support for new XBRL standards, and much more.
One of the most common examples of AI in our everyday lives is facial recognition. Facial recognition is the process of identifying or verifying a person’s identity based on their face. Facial recognition is used in many applications, such as unlocking our phones with FaceID, tagging our friends on social media platforms like Facebook, and checking in at airports or hotels with biometric scanners. Facial recognition can make our lives more convenient and secure, but it can also raise some privacy and ethical concerns. For instance, how can we ensure that our facial data is not misused or stolen by hackers or malicious actors? How can we prevent facial recognition from being used for surveillance or discrimination? How can we ensure that facial recognition is accurate and fair, and does not have any biases or errors?
The paragraph above was generated by ChatGPT in response to my request to describe the benefits and risks of artificial intelligence and include a real-life example. It’s interesting that ChatGPT chose FaceID as the example, since FaceID is simply one variation of image analysis and AI-powered image classification offers potential to automate many real-world tasks.
One common use-case is a product catalog, wherein a company manages product information provided by many different manufacturers. A product loaded into that database may have a name that does not necessarily include a precise description of the item. For instance, wellington is a boot, fedora is a hat, a mongoose is a bicycle, and a yellow watermelon shiny needlefish is a fishing lure. We can make use of AI-powered image classification using the Microsoft Azure Cognitive Services Computer Vision API to address this problem. The Computer Vision Service takes the image data or URL as its input and returns information about the content. One service generates image classification tags based on a training set of recognizable objects, living beings, scenery, and actions that the Azure AI has been trained on. These tags allow us to categorize products in the database accordingly and may even correspond to search terms a user might provide to find products in the catalog.
Automated sentiment analysis of text, such as user reviews, has historically been a challenge. Because of the myriad intricacies of natural language, systems faced difficulties in analyzing context and nuances. This required an inordinate amount of manual work to overcome.
One of the many useful capabilities of modern AI systems that are based on large language models (LLMs) such as OpenAI’s GPT-4 is that they are very good at sentiment analysis of natural text inputs. We can use that capability to build a very efficient database solution in MapForce that, for example, goes through all the new incoming records in a support database and automatically determines whether a particular support request or other customer feedback is positive, negative, constitutes a bug report, or should be considered as a feature request.
Data mapping plays a vital role in modern data-driven organizations, enabling efficient data management and integration. Altova MapForce is a powerful, graphical data mapping tool that supports endless data transformation scenarios, including one-to-one, one-to-many, many-to-one, and chained data conversion.
While there are applications for each of these approaches, chained data mapping is especially helpful for complex data processing tasks where multiple stages of data manipulation are required. Here’s a look at the benefits of a chained data conversion approach – and a video of how MapForce makes the process easy and straightforward.
Altova MapForce offers a powerful, yet easy-to-use, approach to converting and transforming data. Whether you need to write XML to a database, convert JSON to EDI, or map Excel to multiple different data formats, MapForce has you covered.
From simple one-to-one conversions to complex ETL scenarios, the MapForce approach is to represent data structures as graphical components. To associate fields, drag and drop connecting lines. A comprehensive library of data filters and functions is available for transforming data before writing it to the target.
We have recently revamped our series of Introduction to MapForce videos. Each short how-to gives a demo of a common MapForce scenario.
Start at the beginning to learn how MapForce works:
You can follow along with the examples in these how-to videos by downloading a free, 30-day trial of MapForce. Check back for new MapForce videos, which are added often.
Software developers and other data professionals often need to transform data from one format to another. These transformations can be simple one-to-one conversions or may require more complex manipulation. For instance, relationships must be generated when importing flat CSV files into a database, or source data may need to be split for the target, as in full name vs. first, middle, last, and optional suffix. Validating data transformation is critical to prevent data loss or corruption.
In an earlier post on Web service data integration, we combined a string value for GMT time with a numeric offset in seconds to generate the local time for weather forecasts. We created a user function that performed all the steps required to complete this operation. MapForce includes a powerful interactive data mapping debugger that can easily trace and validate this transformation. Let’s take a look at how it works.
Electronic Data Interchange (EDI) has proven to be a durable business-to-business communication technology in use today with history dating to the 1960s and even earlier. Efficient EDI data encoding reduced transaction payload size and improved data transfer speeds at a time when messages were sent over teletype at speeds equivalent to a 300 baud modem. EDI standards bodies promote wide acceptance among enterprises, and systematic evolution of new EDI formats extends support across industries. EDI improves profitability and is a dominant format for e-commerce data exchange.
Despite the advantages, EDI files are barely human readable and need to be translated and mapped for compatibility with other business technologies. Altova MapForce is a graphical EDI mapping tool with native support for all major business data formats in use today, including XML, JSON, databases, flat files, Excel, and Web services, as well as the EDIFACT, X12, HL7, NCPDP SCRIPT, IDoc, PADIS, and SWIFT EDI transaction sets. MapForce can even automatically convert EDI to XML without the need to specify a target XML Schema or perform any manual mapping.
Nothing’s more frustrating than getting unintended results from an XSLT or XQuery transformation and having to spend hours tracking down the issue – especially if you’ve inherited the project from another developer or haven’t looked at the code in a few months. Of course, XMLSpy has long included an XSLT debugger and XQuery debugger for setting break points and stepping through transformations to identify problems.
With back-mapping enabled, you can simply click on or hover over the portion of your output document you want to zero in on, and XMLSpy will immediately highlight the source XML and XSLT or XQuery instruction that is responsible. Let’s see how it works.
MapForce supports mapping protocol buffers (Protobuf) to and from other structured data formats as mapping sources or targets. In the constant quest for more efficient ways to transfer, manipulate, and manage large structured data sets, Google has created a language- and platform-neutral data format similar to XML, but smaller, faster, and simpler than even JSON data. Tools are available to generate and work with Protobuf using Java, Python, C++, C#, Ruby, and other programming languages.
The structure of any Protobuf message is defined in a .proto file that defines each field name and value type. Altova MapForce lets users drop these .proto files into a data mapping as a source or target along with any other data, including XML, JSON, relational databases, Excel, flat files, REST and SOAP web services, and others. .proto files versions 2 and 3 are supported.
A MapForce data mapping creates compatibility between existing XML, JSON, database or legacy data formats and new applications leveraging the efficiency of Protobuf.
Excel began life as a simple spreadsheet tool. Over time, support for rich text styling options, built-in charts, and copy and paste formatting features has led many enterprises to create reports in Excel documents. This can cause difficulty when data changes and existing documents need to be manually updated for distribution to a wide audience in the familiar report style.
Altova MapForce, the award-winning, graphical data mapping tool for any-to-any conversion and integration, supports Excel data mapping to convert data to existing Excel documents while preserving styles and formulas in the original.
This feature lets you write directly to nicely formatted Excel files to update data at runtime: any designated worksheets, rows, and cells from the specified file will be replaced with data from the mapping and all formatting in the existing file will be preserved as-is. To protect functionality in the existing spreadsheet, cells with formulas are not overwritten.
Let’s look at an example of how to map Excel data.
XSLT3 adds trigonometry and other advanced math functions, new formatting functions, functions to collect environment variables, and more, extending XSLT and XSLT2 XML transformation standards. Data analysts and other data professionals can apply XSLT3 functions to solve XML data mapping and integration challenges that require complex mathematical computations. Let’s look at some MapForce examples of data mapping with XSLT3 math functions using trigonometry and other complex math expressions.
In the latest release of Altova desktop developer tools and server software products, we’re introducing a completely rebuilt XML Grid View, support for XSLT3 for XML data mapping, statistics and charts for monitoring FlowForce Server, and much more. Let’s take a look at the highlights of Altova Software Version 2021 Release 2.
Binary objects – BLOBs — can be cumbersome to manage in databases. In an earlier post we described a MapForce data mapping to insert binary objects into a database with generated metadata to identify the BLOBs later. The companion challenge in data mapping binary objects is to extract binary data and save it in a comprehensible form faithful to the original.
Binary objects are difficult to manage in databases. They are large, their content is not human readable, and they can contain bytes of data easily misinterpreted as control characters. Even the data type name for binary large objects – BLOB – reflects most database managers’ dislike of them. Before relational databases, the definition of a blob was “something undefined or amorphous.”
Altova MapForce, the award-winning, graphical data mapping tool for any-to-any conversion and integration, includes features for effortlessly data mapping binary objects to or from all popular relational databases. Data such as images, PDF files, video files, or any other binary data can be mapped. Let’s look at an example.
In a previous post we wrote that every data integration and reporting task needs to start with a clear understanding of the source data. Using grid view in XMLSpy, the industry-leading XML and JSON editor, we analyzed JSON data for 5-day weather forecasts retrieved from a Web service.
Continuing with our earlier scenario, we’ll use MapForce, the award-winning, graphical data mapping tool for any-to-any conversion and integration, to map the forecasts for a series of major cargo shipping ports into nicely formatted Excel documents. We’ll want to highlight any predicted high winds or heavy rainfall that could cause delays by interfering with cranes loading and unloading containers, or slowing ships entering and exiting the harbors.
Altova MissionKit tools offer numerous ways to connect to, query, and integrate data from disparate sources. With multiple product releases each year, we’re constantly working to deliver increased power and efficiency for data integration, while adding features requested by customers. This includes ongoing updates to built-in support for all major SQL databases across the product line.
Let’s take a look at some of the recently added tools and
enhancements.
It’s a common requirement to convert non-standard or legacy text files to or from structured data formats like XML, JSON, and relational databases. However, many times legacy text files are not in a format that can be readily processed by data mapping tools, especially when they have a complex and unique structure that does not consistently fit into CSV or fixed-length field patterns. Moreover, sometimes you need to extract only portions of useful data from a legacy text file.
MapForce, Altova’s any-to-any data conversion tool, includes a unique utility called FlexText that makes it easy to visually define templates for parsing text files and making them accessible to the data mapping tool.
See how FlexText works in our video tutorial.
The example files referenced in the video are available here and you can try FlexText with a free, 30-day trial of MapForce.
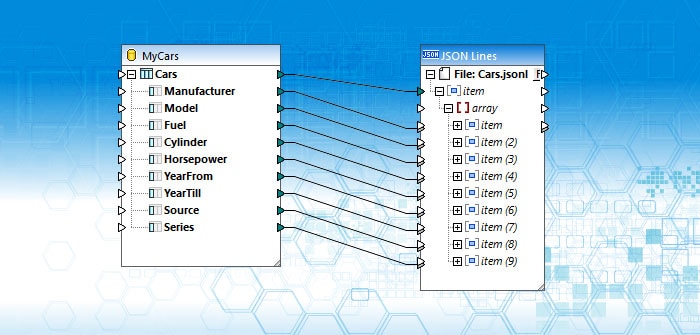
The JSON data format continues to evolve as an open standard as it is creatively applied to new data interchange requirements. JSON Lines, defined at http://jsonlines.org/, is a convenient text format for storing structured data where each record is a single line and a valid JSON object. JSON Lines handles tabular data and clearly identifies data types without ambiguity. This allows records to be processed one at a time, which makes the format very useful for exporting and sending data.
Altova MapForce supports data mapping JSON Lines as either a data source or target. Let’s look at a mapping project to extract records from a database table and map to a JSON Lines file for output.
Data analysts and other professionals often need to generate
real-time data through automated execution of data mappings that request Web
services and save the results. During automated execution it’s important to
gracefully handle any unexpected HTTP error rather than terminate the
integration task.
In an earlier post we discussed conditional processing of a REST Web service response to handle HTTP errors, where separate output files were generated for a normal response and an error. Now let’s look at a revised mapping solution for the airport status example to generate a single mapping result file that contains either the requested airport status or a description of the error.
Data integration projects that include information from
external Web services may be vulnerable to HTTP errors when retrieving remote
data. When data mappings run under automated control it’s especially important
to detect and report errors even if errors only occur very rarely.
A MapForce data mapping can include Web service calls and output
the result directly to a file or database, or combine it with other inputs for
further processing. Regardless of the final output, an HTTP Web service error
encountered in a REST Web service request puts the mapping at risk.
MapForce includes features for handling HTTP errors instead
of simply aborting execution of a mapping. Developers can configure the body of
a REST Web service call to handle and report exceptions based on the HTTP
status code returned.
Critical business processes depend on reliable data and database administrators and other data analysts want to be confident in the integrity of information stored in database tables. During automated ETL (Extract Transform Load) operations or other database import tasks, invalid data might be encountered that jeopardizes success of the procedure. Altova MapForce includes database exception handling to roll back the affected data when an error occurs and optionally proceed with the rest of a database mapping.
For instance, an error in a single record need not prevent execution of a mapping from continuing, such as when certain database constraints prevent the mapping from inserting or updating invalid data.
Database administrators and other data professionals often
want to maintain a record of changes in critical databases, especially when updates
are made by automated scripts or other operations. Database tracing lets
administrators track critical changes or anomalies, and help recover from
errors. Altova MapForce supports database tracing for all popular relational
databases to log the changes made by a data mapping project to the
database when the mapping runs.
When tracing is enabled, events such as database insert or
update actions, or errors, are logged in an XML file that you can later analyze or process further in an automated way.
Database tracing can be enabled at the database component, table, stored procedure, or database field level. You can choose to trace all messages or only errors, or you can disable tracing completely.
In addition to tracing errors that occur during the execution of a mapping to a target database, MapForce also enables database transaction handling to roll back the affected part of the database data when an error occurs, then optionally proceed with the rest of the mapping.
Altova Software Version 2019 introduces over 20 new features to help you sharpen your development game – starting with support for high-res monitors in both XMLSpy and UModel. There are also tools for working with new standards and database versions across the product line, the ability to map and convert data in Google Protocol Buffers format, and much more. Let’s take a look at the highlights.
MapForce node functions simplify mapping hierarchical data such as XML nodes or CSV, JSON, EDI, or database fields by permitting users to define a data processing function at the node level and apply it recursively to all descendant items.
Similarly, default values can also be assigned to nodes and automatically applied to descendants.
Defaults and node functions are particularly useful when a data mapping and transformation task requires the same processing logic for multiple descendant items in a structure, for example:
Replace null values with some other value, recursively for all descendant items
Replace a specific value (for example, “N/A”) with some other value recursively for all descendant items
Replace all database null values when reading from a database table
Trim all trailing spaces for all values from a source database
Append a custom prefix or suffix to all values written to a target file or database
Formatting of output values
And many others
Defaults and node functions simplify mapping hierarchical data by eliminating need to copy-paste the same function multiple times into a mapping. Repeating the same function unnecessarily clutters the mapping layout and makes it more difficult to understand or revise.
EDI (Electronic Data Interchange) standards allow participants with different roles in an industry to communicate clearly and rapidly, and date back to the earliest implementations of electronic communication in the 1950s, long before modern business technologies such as ERP, CRM, and many others. Yet even today, EDI standards continue to evolve to support new requirements and opportunities.
SCRIPT is the state of the art EDI standard developed by the National Council for Prescription Drug Programs (NCPDP) for electronically transmitting medical prescriptions, also known as ePrescribing (eRX) in the United States.
MapForce Server automates recurring execution of data mappings and transformations designed and tested using Altova MapForce. Every day, MapForce Server is employed in business communication, financial reporting, database ETL, and many other applications to transform critical data between any of XML, JSON, database, EDI, XBRL, flat file, CSV, Excel, and/or Web service formats.
Now, MapForce Server Accelerator Edition offers even faster throughput for high-performance server platforms.
Envision a manufacturing company that controls costs by exploiting a just-in-time assembly process with a very low supply of parts inventory on hand. New customer orders are logged in a sales database and at the end of every day the components needed to assemble that day’s sales are tabulated.
The IT department runs a SQL query to identify the required parts and transforms the list into a purchase order in JSON format to be transmitted to the supply chain.
Sound familiar? Our recent blog series on JSON tools and JSON data mapping were based on this real-life scenario. In this post we describe a MapForce Server use case that automates the repetitive task of generating each day’s purchase order.
JSON is a popular format for transferring data between systems thanks to its simple markup, small footprint, and heritage based on the JavaScript programming language. MapForce supports JSON as both an input and output format for JSON data mapping and transformation. For instance, MapForce can extract information from any popular database and produce a JSON file ready for transfer. The Requirement: Here is an example of a typical need for JSON data mapping: A manufacturing company controls costs by exploiting a just-in-time assembly process with very little parts inventory on hand. New customer orders are logged in a sales database, and at the end of every day the components needed to assemble that day’s sales are tabulated via a query into the database. The required parts will be ordered from suppliers via a purchase order transferred in JSON format.
Any computer industry standard that promotes reliability and clear communication between independent enterprises will have a long life. EDI (Electronic Data Interchange) originated in the 1960s to enable automated transactions between corporate computer systems. EDI remains in widespread use today and continues to evolve to meet modern requirements, under the administration of the UN/EDIFACT and ANSI standards bodies.
Altova MapForce supports EDI data mapping between EDI messages and XML, JSON, relational databases, flat files, Excel, or other data formats to bridge between commonly used information interchange and in-house technologies.
MapForce includes support for the latest EDIFACT versions 2015B and 2016A including the new VERMAS message. Mapping and translating EDIFACT messages to other usable data types for transfer, storage, and management is a common business requirement solved by MapForce.
There are situations, especially when encountering loosely structured data, where you may want to map and transform structural components of a data stream along with content. MapForce can dynamically access node names of XML elements, attributes, or text file columns such as the contents of CSV files, to target components.
Dynamic access to node names allows creation on the fly of target elements and attributes whose names do not need to be known beforehand or specifically identified in the data mapping. This feature lets you create much more generic, flexible, and reusable mappings that require less manual intervention if data models evolve.
Electronic Data Interchange (EDI) standards accelerate commerce worldwide by allowing companies and other organizations – even those in different regions, using different languages and currencies – to send and receive unambiguous information. Some EDI communication protocols and message formats still in wide use today were developed over 30 years ago, when telecommunication systems were slower and data storage was more expensive.
The usefulness of the XBRL standard reaches far beyond SEC requirements for filing financial statements. Organizations such as XBRL.US and XBRL International are working to develop XBRL taxonomies and accompanying software solutions for countless other practical applications where standardizing data submission results in increased accuracy and productivity for all involved – for report filing, data analysis, and beyond.
One such project is the Work in Progress (WIP) Taxonomy created by XBRL.US for the surety industry. The new taxonomy helps save time and increase accuracy for report submission, and at the same time enables new opportunities for data analysis and decision making.
MapForce 2016 Release 2 includes expanded functionality for Web Services data mapping, providing robust support for REST Web services. MapForce accepts XML or JSON as the Web service response, allows definition of parameters, and supports custom HTTP headers. Users may define the Web service interface manually or by importing settings from a WADL file or a URL. Manual definition of REST Web Service Settings lets developers create settings based on a template URL. This is a convenient step when developers test and refine REST calls in a Web browser window, since the URL can be copied from the browser to become the template.
I’m excited to reveal some details of today’s Release 2 of Altova MissionKit 2016 desktop developer tools and software products!
v2016r2 introduces over 20 new features and updates to the Altova product line – but that’s a lot to cover in one blog post. Let’s take a look at the top five that are sure to blow your socks off.
Altova MapForce includes powerful mapping components that correspond to design patterns for data transformation requirements. Analyzing a data mapping challenge up front and following a few straightforward guidelines can uncover data mapping patterns that help simplify creation of the mapping design and lead to an optimal solution. The MapForce Examples project provides sample mapping files and data sets that illustrate many common data mapping patterns. Reviewing these examples and executing them with the MapForce Built-in Execution Engine is another good way to help select the best pattern for your own project.
MapForce 2016 introduces a revolutionary data mapping debugger that lets developers working on data integration projects examine data mapping output step by step to diagnose and perfect projects of any complexity. The MapForce data mapping debugger gives users deep insight into the exact inner workings of data integration and ETL projects in a way that was never before possible.
The MapForce data mapping debugger supports breakpoints and conditional breakpoints, and includes multiple manual stepping options to manually debug a data mapping or continue execution after a breakpoint is reached, allowing users to see as much detail as they need. Read more…
We are excited to announce details of the latest release of Altova MissionKit desktop developer tools and server software products. Version 2016 includes full Windows 10 compatibility and updated relational database support across the product line, and it also introduces some new features that you simply will not find anywhere else.
XMLSpy 2016 includes the first full featured, enterprise-grade graphical JSON Schema editor. MapForce, our data integration tool, now includes a data mapping debugger that will revolutionize the way you define and test data mapping projects. Let’s take a closer look at these new features.
As more specialized data is adapted for delivery on demand to mobile devices with smaller screens, documents with complex structures can be a challenge. Fortunately, MapForce, Altova’s graphical data mapping, conversion, and integration tool, has special features to accelerate data integration projects of all sizes.
For example, richly-formatted documents may include XML mixed content, a complex datatype that permits an XML element to contain text, attributes, and other child elements. Common instances of XML mixed content include blocks of text with tags for bold or italic fonts, or tags that select terms for indexing or other special treatment. Documents with XML mixed content can be difficult to include in a data integration project, since they appear to be free-form and unpredictable, with child elements that occur in any order or even multiple times within the parent.
Release 3 of the Version 2015 Altova MissionKit desktop developer tools and Altova server software products is now available with updated standards support, customer requested features, and innovative new functionality that will save you time on everything from XPath and XQuery development, to advanced data mapping, to XBRL report rendering and beyond. You can skip right to the good stuff and upgrade now, or click Read More below for all the details.
The data engulfing enterprises today comes from many seemingly unrelated sources. Collecting, refining, and assimilating all this information, and being flexible enough to accept new data formats and resources, is critical to success in the 24/7 connected world.
This data integration whitepaper gives business executives, data analysts, data-focused developers and others an overview of current trends and issues in data integration, then discusses how Altova MapForce combines with Altova Server products to create a highly automated enterprise data integration platform that is configurable, scalable, and cost-effective.
To cover all the relevant, up-to-date information, the whitepaper even includes a section titled Data Integration for Mobile Devices that discusses how Altova MobileTogether easily integrates to bring data integration results to mobile devices, providing business intelligence dashboards, elegant enterprise forms, and much more in today’s cross-platform BYOD (bring your own device) workplaces.
MapForce 2014 now supports mapping of XML wildcards that create a designed-in extension mechanism for XML Schemas, implemented as <xs:any> or <xs:anyAttribute>.
This small portion of a very long file shows two track points recorded during a road trip by a Garmin GPS device. The XML data follows the GPX XML Schema, with Garmin extensions to add speed and course heading values. XML wildcard mapping lets you map these extensions in MapForce just like any other elements explicitly defined in the XML Schema.
Let’s assume we want to read the .gpx file and extract the highest speed recorded for a trip:
Simply unzip the archive into a new folder and you’ll have all the data mappings, the stylesheet, and other supporting data files all in one place. A ReadMe file explains the contents. You can download fully functional free trials of Altova MissionKit and FlowForce Server at https://www.altova.com/download.html and implement and test FlowForce Server yourself.
Or, execute the data mappings in MapForce and the stylesheet in StyleVision to see how easy it is to extract meaningful information from the GPS data recorded by your own digital camera or GPS device. The example files in the download were also used in Web Service as a Look-Up Table to Refine GPS Data, XPath Enhances XML Reports, and others in our series on working with XML and Global Positioning Systems.
If you’re already an Altova MissionKit user, you can download these files with examples of Web services and user functions for MapForce, and XPath calculations and chart features for StyleVision, and add them to the extensive libraries of MapForce and StyleVision samples installed with Altova MissionKit tools.
Bad data in an input file can cause the data transformation step of a FlowForce Server job to fail. When a FlowForce Server Job fails, further execution steps will not be performed. FlowForce Server is designed this way to prevent an error in one job step from cascading into a series of additional invalid results. Happily, FlowForce Server also includes features to help you recover from errors and keep production flowing.
Altova FlowForce Server, launched on April 29, 2013, includes numerous enhancements over earlier beta releases and one of the most exciting new features is the implementation of StyleVision Server. Now a FlowForce Server job can automate a complete data transformation workflow by executing MapForce Server for data mapping and pipelining results to StyleVision Server to render a variety of output formats.This post describes a straightforward FlowForce Server mapping and transformation job as illustrated in these messages from the FlowForce Server Log, with the most recent step at the top of the list:
We’ll start with the GPS log files created by a digital camera. We wrote about these files last January in the post titled Process Multiple Input Files in a Single Data Mapping. We’ll use the mapping output with a StyleVision SPS stylesheet adapted from the XPath Enhances XML Reports post to produce a time and elevation report for each file.A FlowForce Server For-each job step repeats based on the result of an expression. We can use For-each to build a list of files in a folder, then repeat one or more steps for each file. Here is how it looks in the job configuration page:
The line labeled Execute function defines the mapping to be used by MapForce Server, and the input parameter {file} refers to each file in the list C:CameraGPSexample*.LOG.We can add an execution step to instruct StyleVision Server to perform the transformation:
The data mapping creates output files by adding .gpx to the name of the input file, and now we can define the transformation input using the {file} variable with the new file suffix. We chose to create .html output, but we could just as easily create other formats for a multi-channel publishing implementation.The transformation working directory is the location where StyleVision Server unpacks the contents of the .pxf file containing the stylesheet, XML Schema, and other needed components. Using a dedicated working folder will keep the workflow more organized.We want to allow network users to drop new .LOG files into the C:CameraGPSexample folder and we want run the FlowForce Server job on a regular schedule, but we don’t want to process the same files over and over. We can define one more job step to move the processed file to a different location:
The complete FlowForce Server job is a series of three steps that loops for each .LOG file found in the folder. We can set up a repeating trigger for the workweek or any other appropriate schedule:
Here is a portion of a .LOG file created by the camera that is an example of one input file:
We can drop this file into the C:CameraGPSexample folder, where it will be processed based on the FlowForce Server job trigger:
When the timer triggers execution of the FlowForce Server job, the Web interface Job Log page displays this series of messages for the complete job:
The contents of the C:CameraGPSexample folder now look like this:
We can examine the 121130.LOG.gpx file in XMLSpy:
And we can open the .html file in any Web browser:
In future blog posts we will enhance this FlowForce Server example to illustrate jobs with error handling and more complete cleanup of working files.FlowForce Server is available for Windows, Linux, and soon for Mac OS platforms. To get started yourself, click here to download a free trial!
FlowForce Server is a new product designed to provide automation of data transformations performed by dedicated high-speed servers. FlowForce Server can start jobs based on a variety of triggers, runs multiple jobs simultaneously, and can even run multiple instances of the same job, depending on workflow.Monitoring all these complex activities is critical to success in a busy production environment. The FlowForce Server Web interface includes customizable views into operations, simplifying management from anywhere on the network.
The screen shot above shows the Home page of the FlowForce Server Web browser interface, displaying all currently running jobs and active triggers. Six instances of the gpxElevationUSGS job are running, each identified by a unique job ID. Four job triggers are also active, three watching hot folders, and one based on a timer. Each FlowForce Server job automates a MapForce data transformation.The orange arrows below each grid are clickable update buttons, and the job names link to the definition pages for each job.The blue headings at the top are also clickable buttons. The Log link displays the Log View, a detailed history of all system activity, shown in a truncated version below.
Each message line describes one step in one instance of a FlowForce Server job, and may have links to more information, as we described in our earlier blog post titled Automate Data Transformation with FlowForce Server. If the status is anything other than 0, the more link opens a detailed error message.
In a busy environment, all this can be just too much information. In that case, the Log View offers several alternatives to help you find critical information quickly. The options bar above the list lets you filter items displayed by a particular job or Message severity.
If you only want to know if anything unexpected occurred, select Warning as shown above to hide all normal Info messages.You can also sort the list by any of the column headings Date, Severity, Module, User, or Instance ID in ascending or descending order. When the FlowForce Server is running multiple simultaneous jobs and instances, it’s very likely individual steps from different jobs will be shuffled. Sorting by Instance ID can let you more easily review the job history.Click here to learn more about FlowForce Server Beta 3 at the Altova Web site, or visit the FlowForce Server Beta 3 download page to get started automating data transformations in your data center!