Mobile App Debugging
MobileTogether is a tool for building highly complex, elegant, cross-platform solutions. Developers need mobile app debugging tools to troubleshoot during development and understand app behavior. The MobileTogether Designer offers full-featured debugging of app execution flow inside action trees and debugging of XPath/XQuery functions. These features are provided in two mobile app debugging views integrated into a single tool.
The Actions Debugger view allows developers to debug the Actions of a Control event or a Page event. This view is available when an Action that has been selected for debugging is encountered during processing. The XPath Debugger view opens the XPath/XQuery evaluator window for in-depth tracing and debugging of expressions.
Developers can set breakpoints at various locations and the app, then execute one step at a time, pausing in either view to allow examination of the complete execution environment.
Let’s see mobile app debugging in action:

In an earlier post on programming techniques for mobile development, we used an Air Quality app to illustrate a subroutine in a mobile app. The subroutine, implemented as a MobileTogether action group, calculated the local time of an air quality reading from data returned by an API, delivered as GMT time and an adjustment value. We can debug the subroutine to make sure our calculations are valid.
First, we’ll set a breakpoint at the top of the Calc local time action group to pause execution when the subroutine is called:
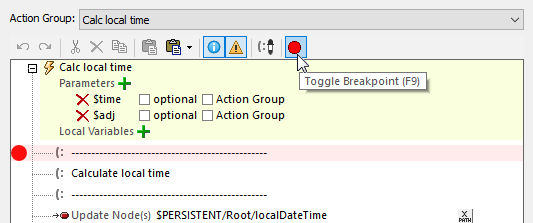
You can add as many breakpoints as you need, and you don’t have to worry about finding them later. They are managed from the main Debug menu:
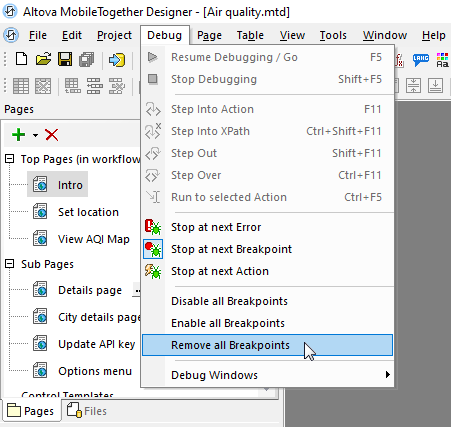
We also used the menu to set the Stop at next breakpoint option. Now we can run our app in the Simulator, and it will execute normally until the Calc local time action group is called.
The image below shows the Simulator display when the app paused at the breakpoint. The user selected a city report for London, the app called the API, and now it wants to calculate the local time from the returned data:
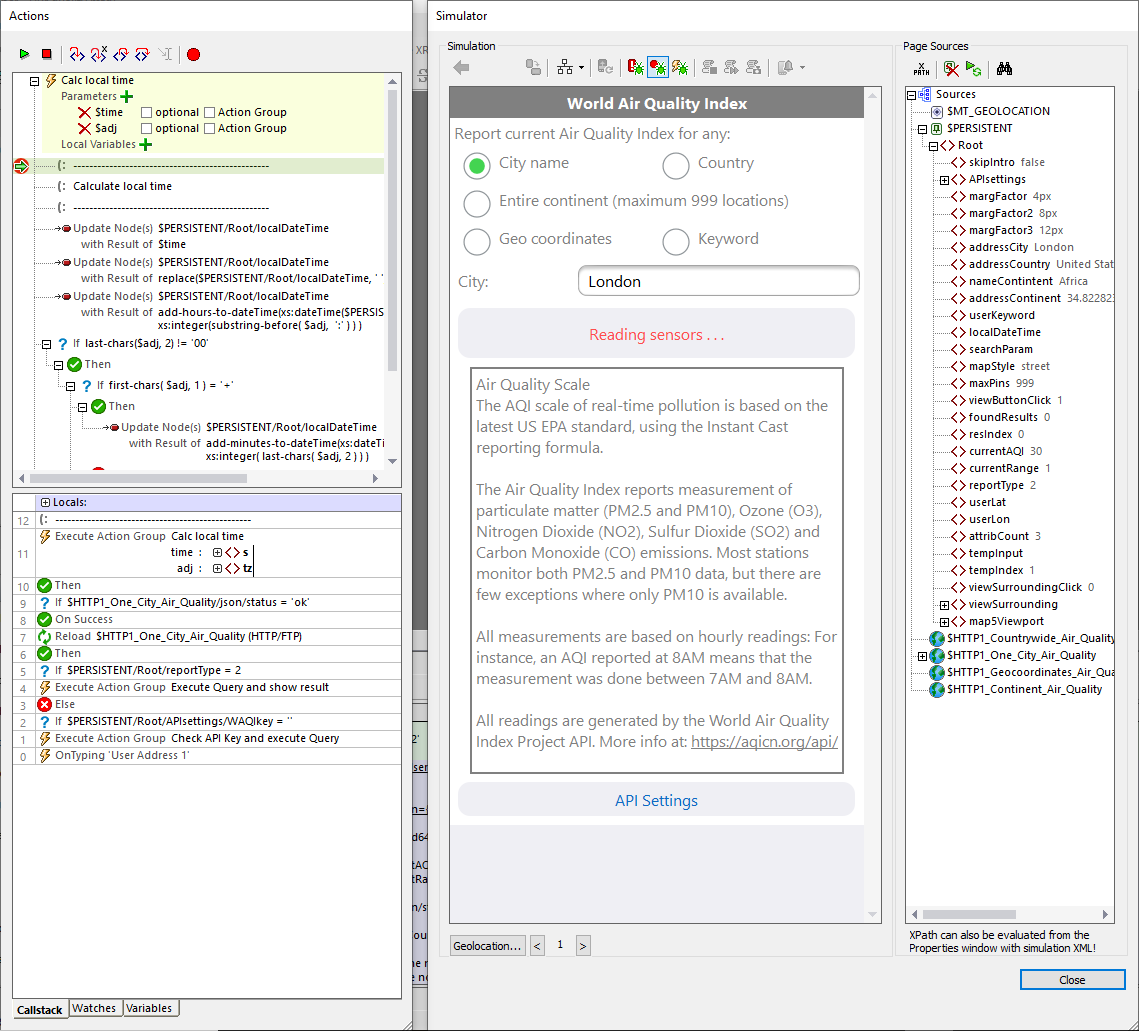
Two debugger panes are open on the left side of the screen. At the top we see the actions about to be performed, with the red breakpoint and a green arrow marking the current step. In the pane below we see the callstack of actions leading up to the action group.
The plus buttons in the callstack display the values of the parameters provided when the action group was called. We can click the Step into action button at the top to continue execution one step at a time:
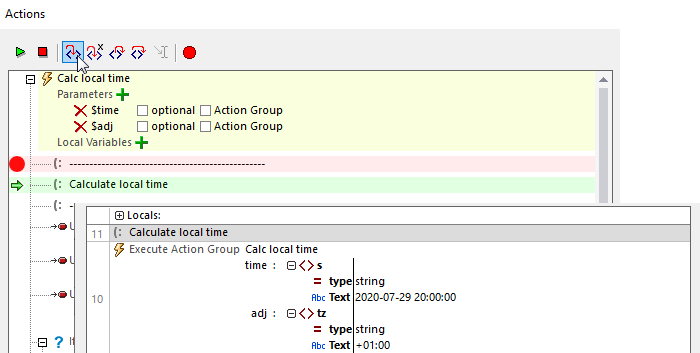
Wait a minute, isn’t London in the same time zone as Greenwich, UK and shouldn’t need an adjustment from GMT? I asked all my smart assistants and all my search engines--they told me London and Greenwich both use British Summer Time, which is one hour forward of GMT.
In any case, that’s the data the API gave us, so we can continue. Stepping through the comments, we come to the first Update Node action:
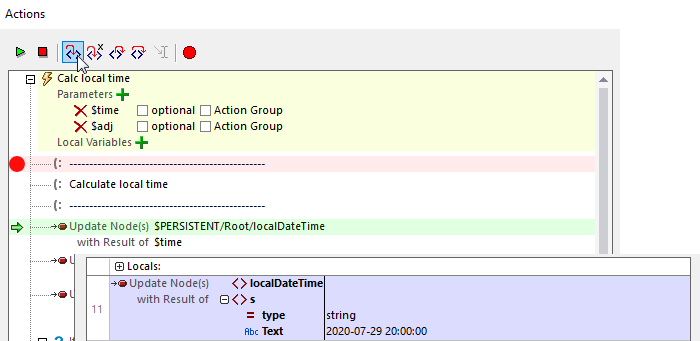
The localDateTime node is set to the $time parameter.
Step again:
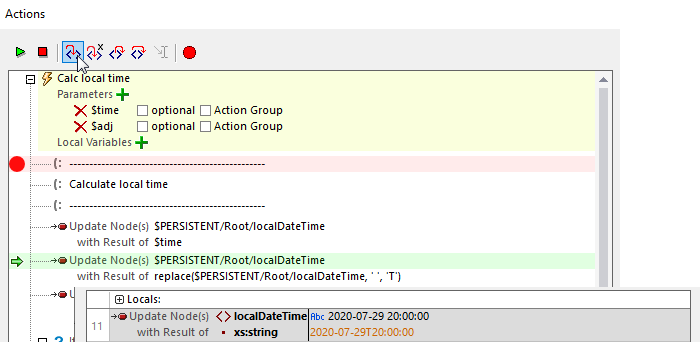
The letter T is inserted between the date and time to match the syntax we need for the add-hours-to-dateTime( ) function.
Step again:
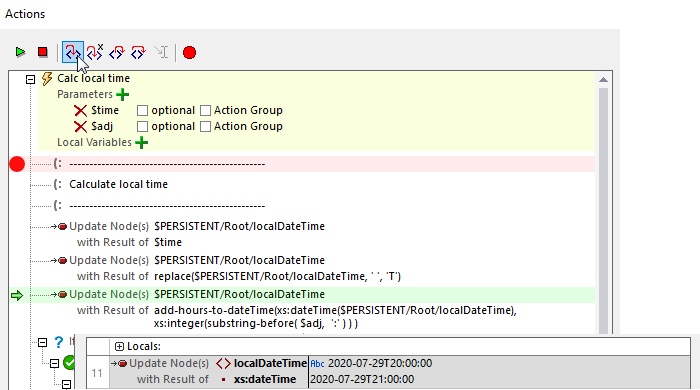
The adjustment hours are added.
Step again:
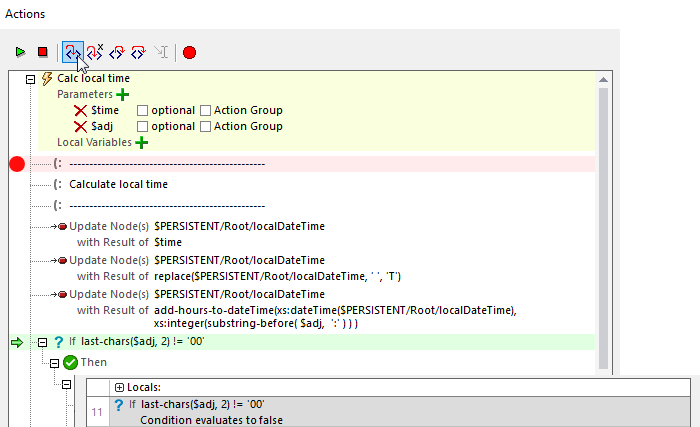
Are there any minutes to adjust? No.
Step again:
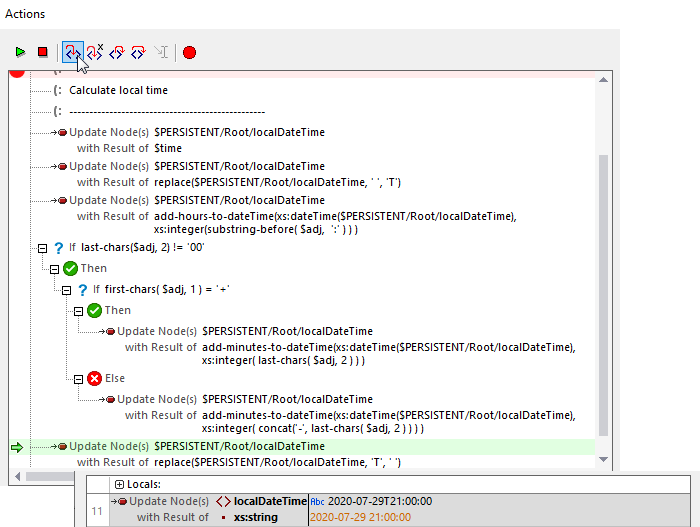
Replace the T with a space.
Step again:
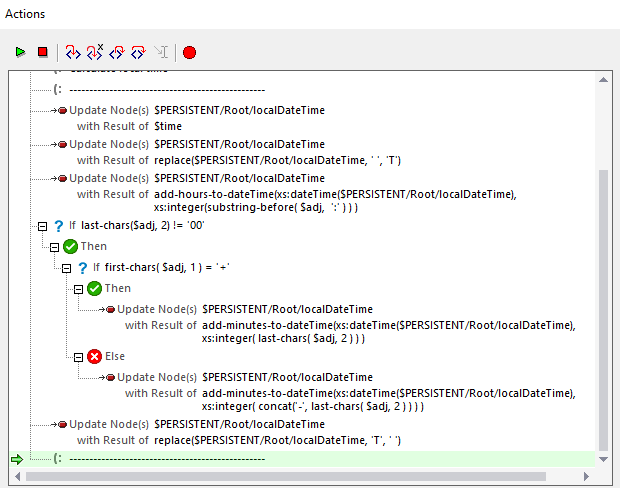
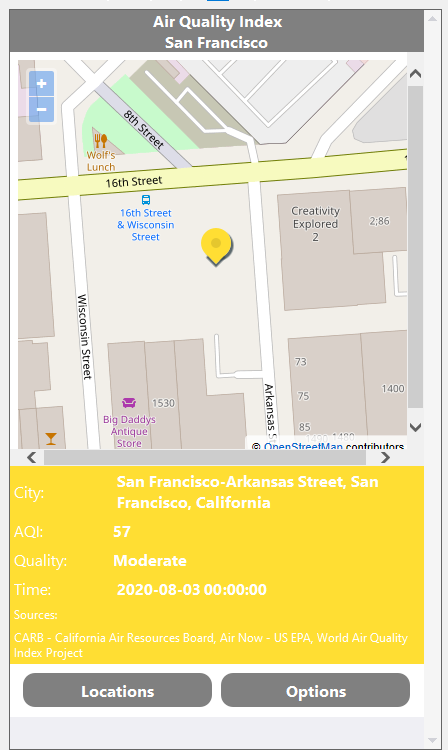
The comment line marks the end of the Action group. Now we can use the green arrow Run button at the top to continue normal execution of the app. A sub page opens to report the air quality index:
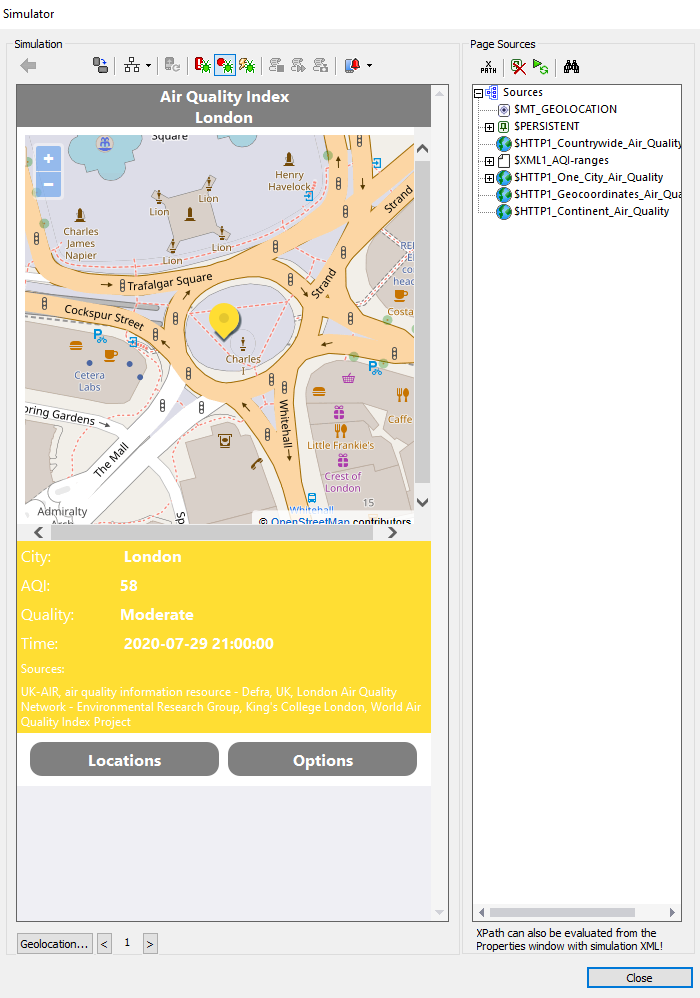
So the mobile app debugging by actions view proved our logic was correct.
But it’s pretty tedious and unnecessary to save the intermediate result each step of the way. We should combine the steps into a single expression:
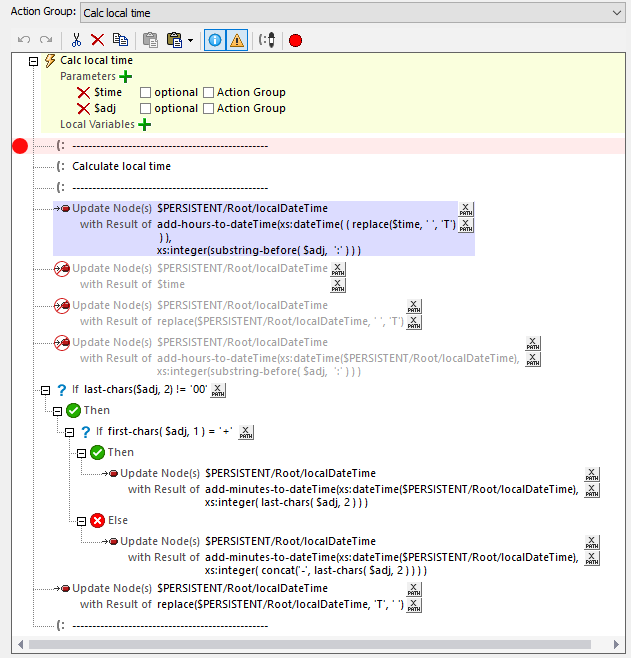
The three original actions are disabled and replaced by one action that includes a complex expression. We can use the XPath debugger view to test this expression.
We could have switched seamlessly between views, but we stopped the first debugging session to edit the expression. Now we’ll run this new version in the simulator. This time when it stops at the breakpoint, we’ll use the Step into XPath button to start mobile app debugging in the XPath/XQuery Debugger view:
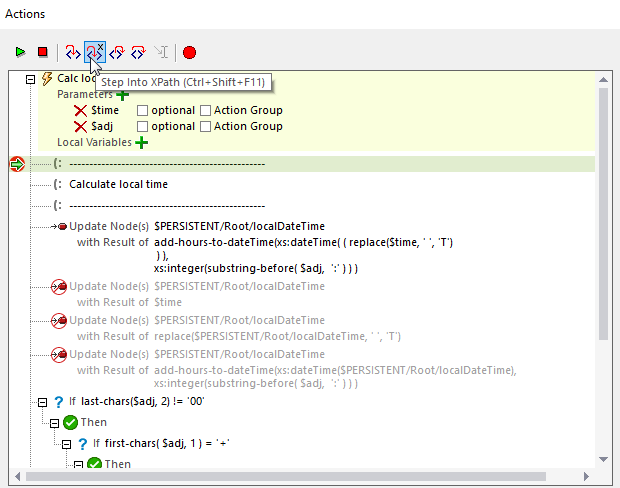
The XPath/XQuery evaluator window opens and the debugger starts to evaluate the expression:
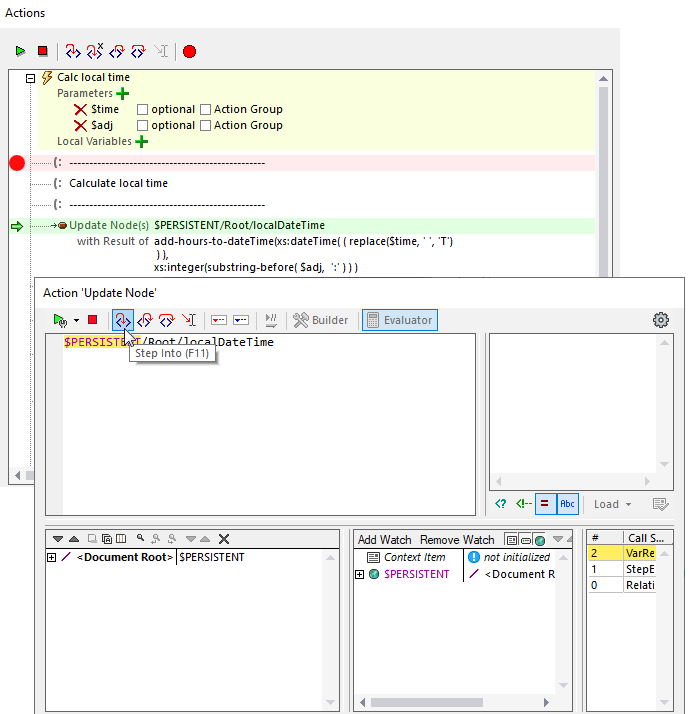
Now we’ll use the Step into button in the XPath window, continuing to walk through the expression:
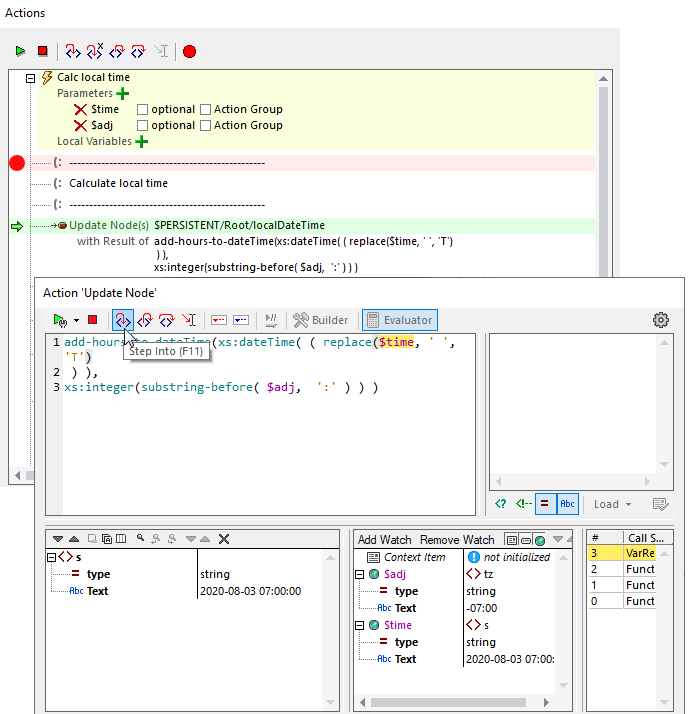
The panes at the bottom of the image identify the contents of the parameters provided when the action group was called. The source of $time was a JSON node s containing string data that was returned by the API.
Step again:
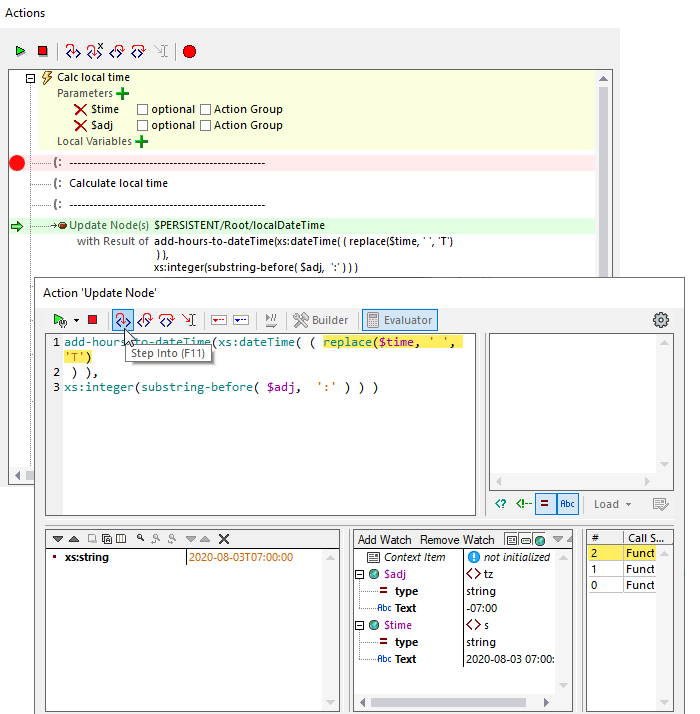
Inside the expression, we still need T to obey the syntax of the add-hours-to dateTime( ) function.
Step again:
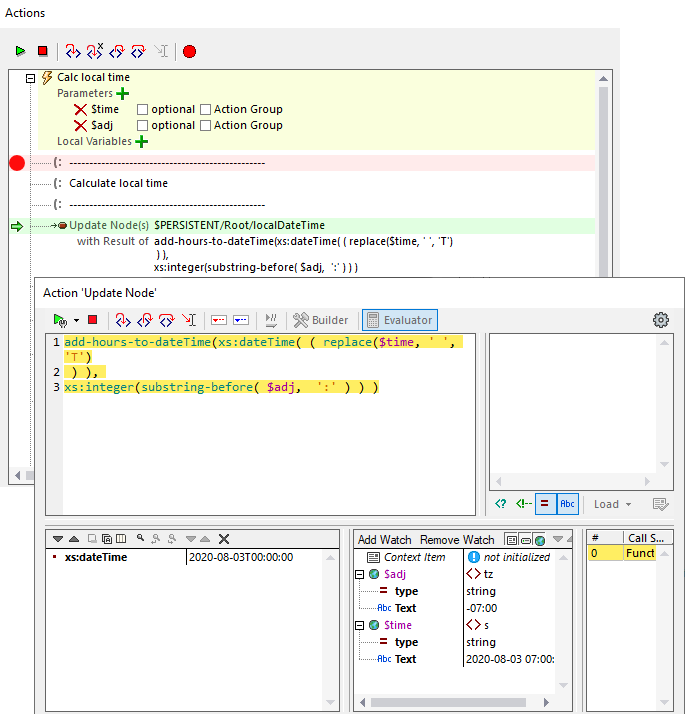
Now we’ve really stepped into it and completed the expression. On this run the original $time parameter was 2020-08-03 07:00:00 and the $adj value for adjustment was -07:00. At this point our result is 2020-08-03T00:00:00.
The next action will be the test to see if we need an adjustment for minutes. The $adj parameter ends in 00, so that test fails, the T is replaced, and the sub page is displayed:
If you’re doing cross-platform development, you need a tool with mobile app debugging! Check out our MobileTogether video demos, more sample apps, or even the online manual for a deep dive into all the info. When you’re ready to jump in and build your own cross-platform mobile apps in the fastest time, download the MobileTogether Designer to get started.