Interactive Debugger for Data Integration Projects
MapForce 2016 introduces a revolutionary data mapping debugger that lets developers working on data integration projects examine data mapping output step by step to diagnose and perfect projects of any complexity. The MapForce data mapping debugger gives users deep insight into the exact inner workings of data integration and ETL projects in a way that was never before possible.
The debugger works with all MapForce data mappings for any combination of XML, XBRL, JSON, databases, flat files, EDI, Excel, or Web services data, including chained mappings, mappings with multiple input or output components, and mappings that include user-defined functions.

The MapForce data mapping debugger supports breakpoints and conditional breakpoints, and includes multiple manual stepping options to manually debug a data mapping or continue execution after a breakpoint is reached, allowing users to see as much detail as they need.
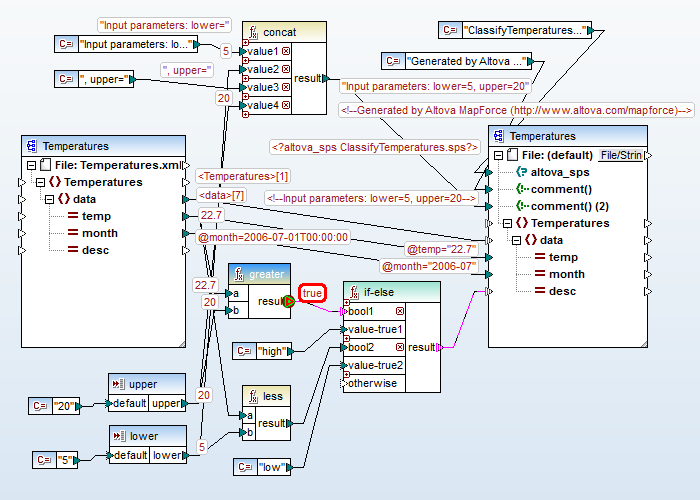
We can walk through a sample debugging session to see the new features and functionality introduced in the MapForce 2016 debugger. The screenshot below shows a data mapping called ClassifyTemperatures that is installed with the MapForce example files. This mapping reads an input file that contains a list of temperatures and dates and produces an output file that adds classification descriptions for high and low temperatures.
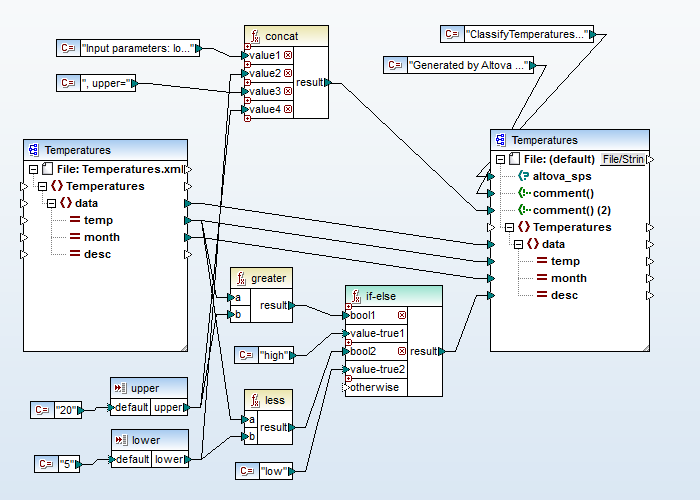
The MapForce debugger breakpoint functionality will be familiar to developers experienced at debugging source code. Breakpoints can be placed on any input or output node, to pause mapping execution at that point, and conditional breakpoints are also supported.
Setting a Breakpoint
We will prepare for debugging by adding a breakpoint to the mapping at the result of the greater function (in the center of the image above) by simply right-clicking the connection arrow. The new breakpoint is highlighted in red.
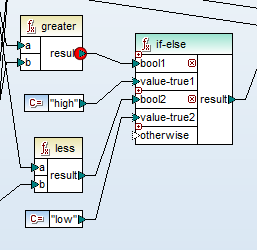
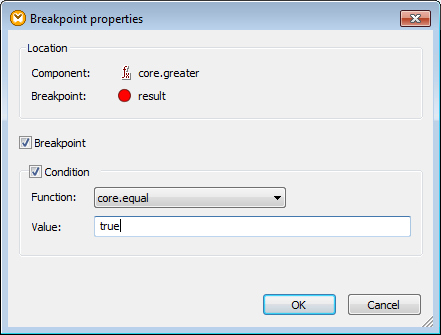
The same right-click menu lets users open a dialog to define this as a conditional breakpoint. The greater function result will be either true or false. We can set the breakpoint so execution of the data mapping will only stop if the function returns “true.”
Interactive Debugging
A menu option starts interactive debugging:
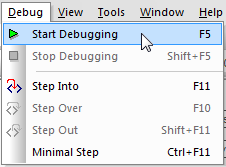
The MapForce Built-In Execution Engine begins processing the mapping and continues until the breakpoint is reached and the breakpoint condition is met. All intermediate values are displayed in red on the mapping design. For large, complex mappings, display of intermediate values can get densely cluttered on the display, so we can move each value to any more convenient location in the mapping window.
The highlighted word “true” indicates the last generated value before execution paused.
Debug helper windows open automatically and provide more information about everything that occurred during execution. The Context window shows what nodes have been processed from the input file and functions that have been evaluated.
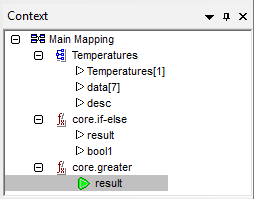
The entry “data[7]” indicates seven temperature values have been processed.
The History helper window automatically displays every result generated from the greater function where the breakpoint is defined. The result was false for the first six values. When value seven generated a result of true, the condition was met and execution paused.
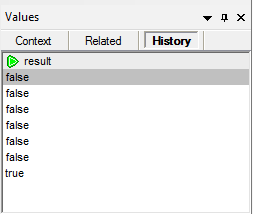
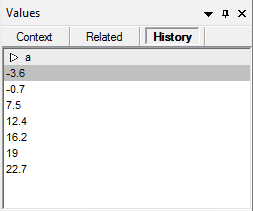
The History window is very powerful. We can select any other connection node in the mapping and the History window will display a list of every value that passed through that node during execution. For instance, we can select an input connection for the greater function, as shown below:
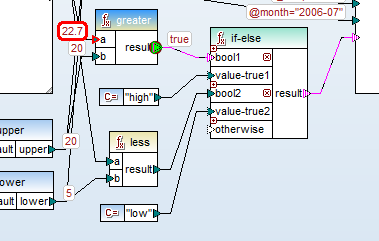
Now the History window shows a list of all the values that passed through that node:
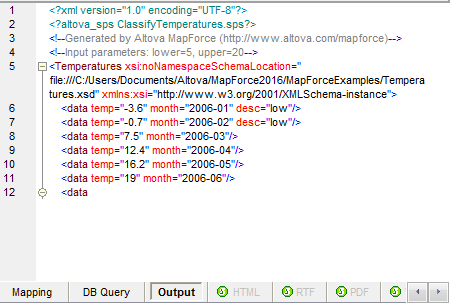
During the debugging session we can switch back and forth between the Mapping window and Output window to examine partial output generated so far, as seen here:
At this point we have several options to proceed:
- Stop the debugging session
- Let execution continue until the next debug breakpoint is reached
- Continue debugging execution by manual steps to carefully examine more intermediate values
If debugging reveals errors or flaws in the mapping design, we can stop immediately, modify the mapping as necessary, then debug the revised version. We can set new breakpoints or select a manual stepping option to view each intermediate generated value, or to step over logical computation groups.
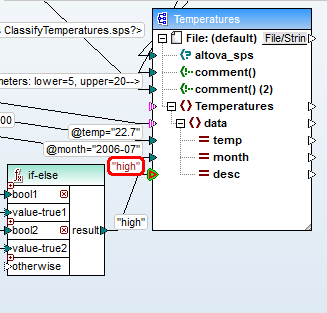
After we step forward several times, we can see the description “high” is generated by the if-else function and passed to the output component.
We step forward several more times and examine the partial output again.
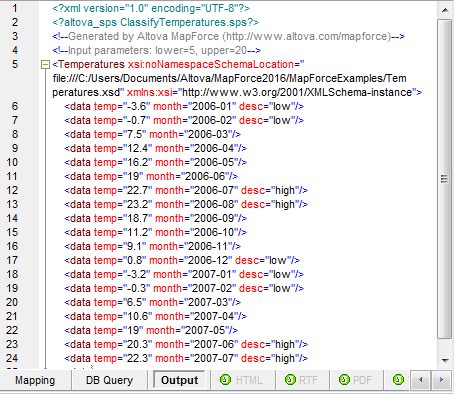
Now completed description for the original high temperature appears on line 12 and additional results have been generated.
Altova MapForce is an award-winning any-to-any graphical data mapping, conversion, and integration tool that maps data between any combination of XML, database, EDI, XBRL, flat file, Excel, JSON, and/or Web service. The MapForce data mapping debugger is a unique feature in a visual mapping designer available at a fraction of the cost of a traditional big-iron data integration system.
Download a fully-functional free trial to try it for yourself!
