How to Debug XSLT and XQuery
Nothing’s more frustrating than getting unintended results from an XSLT or XQuery transformation and having to spend hours tracking down the issue – especially if you’ve inherited the project from another developer or haven’t looked at the code in a few months. Of course, XMLSpy has long included an XSLT debugger and XQuery debugger for setting break points and stepping through transformations to identify problems.
For a more interactive debugging process, XMLSpy also includes XSLT/XQuery back-mapping.
With back-mapping enabled, you can simply click on or hover over the portion of your output document you want to zero in on, and XMLSpy will immediately highlight the source XML and XSLT or XQuery instruction that is responsible. Let’s see how it works.

Debugging XSLT and XQuery with Back-mapping
Because XSLT and XQuery documents are frequently long and complex, it can be difficult to identify the source of unintended output. For targeted debugging, back-mapping makes it easy to immediately see which nodes and instructions are driving the output.
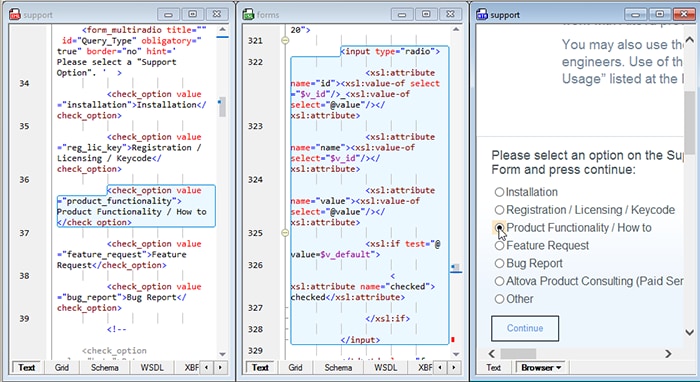
With back-mapping enabled, XSLT transformations and XQuery executions are carried out so that the result document can be mapped back on to the originating XSLT+XML or XQuery+XML documents. When you hover over a section in the result document, the XSLT/XQuery instruction and the XML source data for that result node will be highlighted.
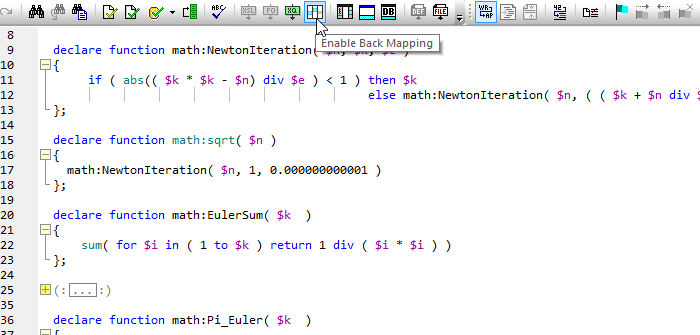
Let's give it a shot. Prior to initiating an XSLT or XQuery transformation, click the “Enable Back-mapping” button on the XMLSpy toolbar.

XMLSpy will give you the option to tile the source and output documents so you can easily visualize related elements in one window. Then, run the transformation.
In the XSLT transformation shown below, I've hovered over one of the radio buttons in the output document in Browser view, and XMLSpy automatically highlighted the source node and instruction in the XML and XSLT documents.

The process works the same in Text View for XSLT and XQuery output - simply select the portion of the output document you need to analyze.
The ability to simply click into your output to identify its source is a huge time saver for testing and debugging XSLT and XQuery code. Best of all, XMLSpy accomplishes back-mapping without modifying your output document in any way.
See how this works for both XSLT and XQuery in this quick back-mapping video.