Database Tracing to Log Changes Made by a Data Mapping Project
Database administrators and other data professionals often want to maintain a record of changes in critical databases, especially when updates are made by automated scripts or other operations. Database tracing lets administrators track critical changes or anomalies, and help recover from errors. Altova MapForce supports database tracing for all popular relational databases to log the changes made by a data mapping project to the database when the mapping runs.
When tracing is enabled, events such as database insert or update actions, or errors, are logged in an XML file that you can later analyze or process further in an automated way.
Database tracing can be enabled at the database component, table, stored procedure, or database field level. You can choose to trace all messages or only errors, or you can disable tracing completely.

In addition to tracing errors that occur during the execution of a mapping to a target database, MapForce also enables database transaction handling to roll back the affected part of the database data when an error occurs, then optionally proceed with the rest of the mapping.
Enabling database transaction handling will enclose all changes done by the database component inside a transaction that will be rolled back in case of error, and you can opt to either proceed with rest of the mapping or stop further execution of the mapping. You can enable transactions at database component level and at table action level.
Let’s look at a database tracing example.
The MapForce Examples folder includes a mapping called Altova_Hierarchical_DB that maps hierarchical data from an XML document to tables in a database.
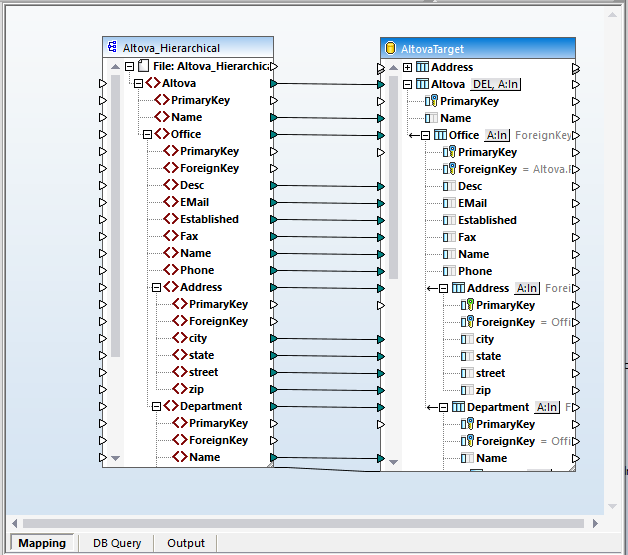
Right-clicking the blue bar at the top of the database opens the properties dialog that includes an option to enable tracing and specify the tracing log file. Tracing may be disabled, enabled for errors only, or enabled for all actions. This is also where you specify the name and path of the database tracing log file.

When the mapping is executed by clicking the Output button below the mapping pane, two files are generated.
First, shown immediately below, is a preview of the SQL script. The database is not modified until the Run SQL-Script option is selected from the Output menu. The second file is a preview of the XML trace log.
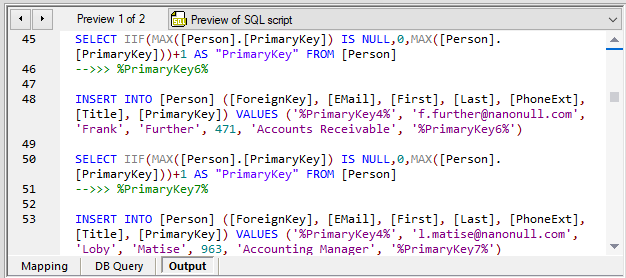
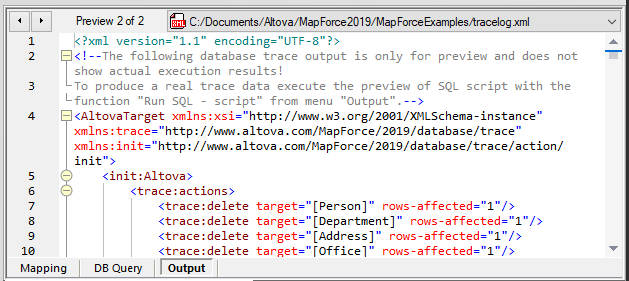
The trace log will be updated later, based on the actual execution of the script, as documented in lines 2-3 above.
Customizing Database Tracing
Sometimes you will want to trace only a few specific operations. MapForce lets you customize tracing at the table, field, or stored procedure level. In the mapping shown here, we might want to trace any errors, plus generate a record of all first and last names added to the Person table.
We can accomplish this by setting the database top level tracing to Errors. Next, we can set the Person Table tracing to Always and select the fields to hide or include:
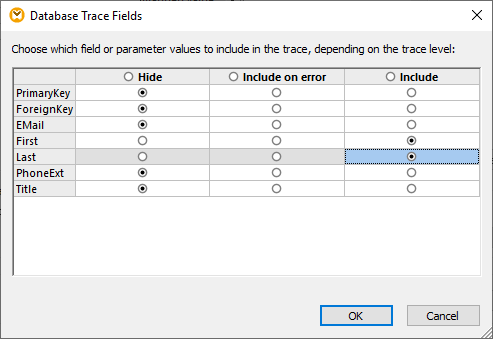
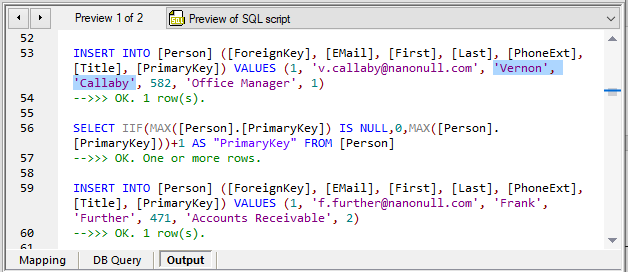
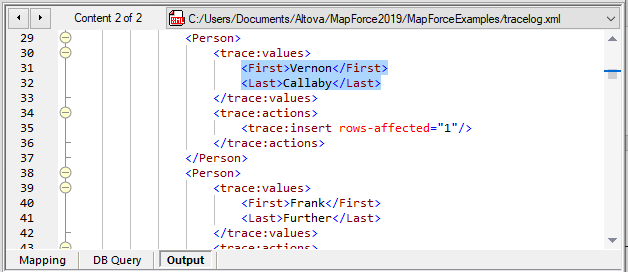
When we execute the SQL script the preview window shows the result of each SQL command. We highlighted one name for emphasis in the screenshots below.
The trace log contains a list of all names added to the Person table:
Any output tracing added to a database mapping will also be performed when the mapping is executed in an automated mode by MapForce Server or under control of FlowForce Server. A FlowForce Server job could even automate processing of the output log XML file to create a customized report.
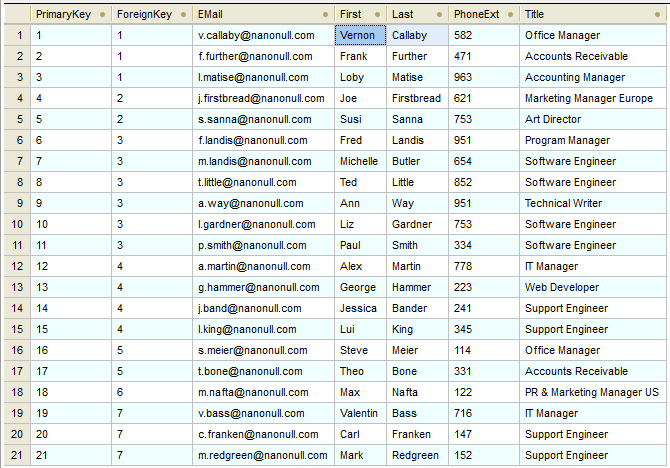
To further validate the result of our example, we can open the database using DatabaseSpy, the unique multi-database query, design, and database comparison tool, and explore the table contents directly:
In a future post we will explore database transaction handling to roll back the affected part of the database data when an error is encountered. Meanwhile, to try database tracing for yourself either by following this example or working with data mappings for your own databases, download a MapForce free trial.
