Creating Elegant Reports for GPS XML Data
In our earlier post on XML for Global Positioning Systems, we mentioned that adventurers and athletes might want to use XML data from their devices to keep a record of their trips, or even training sessions leading up a marathon or other special event. Several colleagues responded by offering example files!
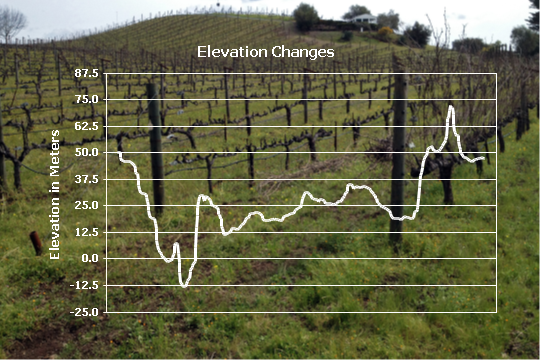
Looking through all this data, we realized that plotting elevation changes over time would show interesting results for many activities. We used XMLSpy to create this customized line graph directly from the XML data to show elevation vs. time for an afternoon of bicycling through California wine country. We even applied the vineyard photo as a background image right from the XMLSpy chart settings dialog.
Whenever you want to elegantly present data from multiple XML data files based on the same XML Schema, Altova StyleVision is the tool that lets you design a richly featured stylesheet for repeatable output in HTML, RTF, PDF, or Microsoft Word formats. Here’s how we did It for our GPS XML data:
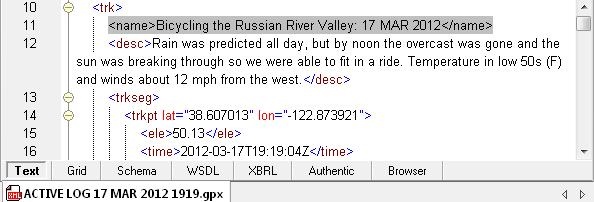
First we opened the GPS data file for each trip in XMLSpy to replace the generic title inserted by the GPS device in the <name> element at the top of the file, shown on line 11 in the screen shot below. The gpx.xsd schema defines an optional <desc> element for a description that can appear after <name>, so we added that element and wrote some commentary about the trip.
Next we used StyleVision to create a new SPS stylesheet based on the gpx.xsd schema, using our edited .gpx file as the working XML. We created a simple headline for the document and dragged the <name> and <desc> elements into the design window.

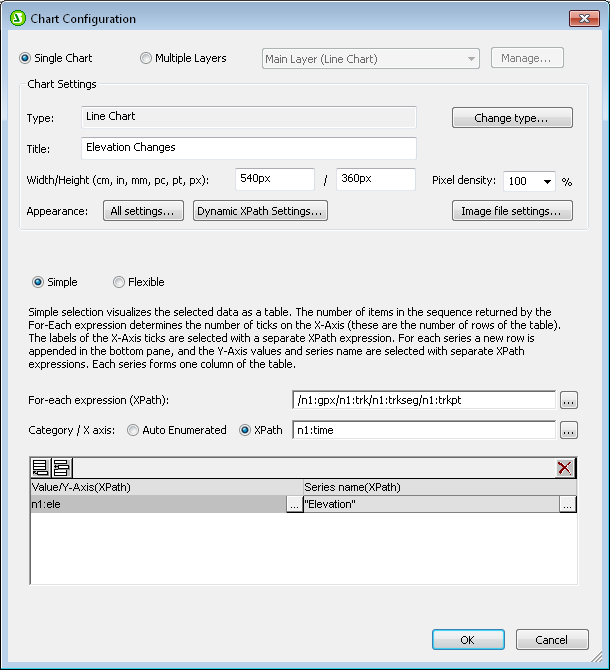
We wanted to insert the elevation chart next. All the chart settings were already saved in XMLSpy, so we could easily load the design into our stylesheet using the All Settings button in the StyleVision Chart Settings Dialog. We also wrote XPath expressions to select the time and elevation data from the working XML file.
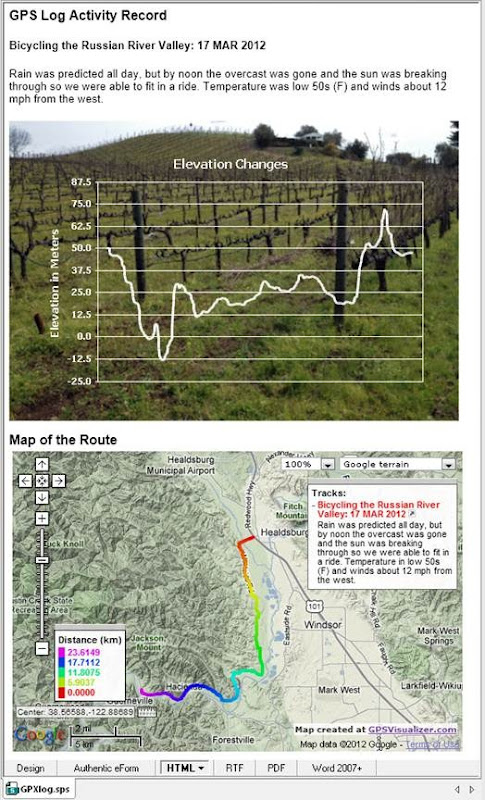
We thought it would interesting to compare the chart of elevation changes to the map route, so we plotted the route using the GPS Visualizer Web site, took a screen shot of the map, and added it to the our design using the StyleVision Insert / Insert Image menu option.
As we built the design, the Preview buttons along the bottom of the StyleVision Design window let us preview the document in any supported output format. Here is the Russian River Valley GPS data rendered by StyleVision in HTML, using the final version of the stylesheet:
We needed an easy way to apply the same stylesheet to other GPS XML files. A StyleVision Project collects related files so they can be easily accessed by an SPS stylesheet, so we defined a project that includes the external folder containing all the files we used to create our design.
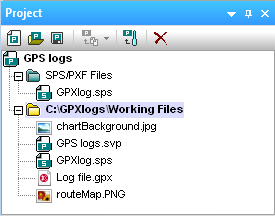
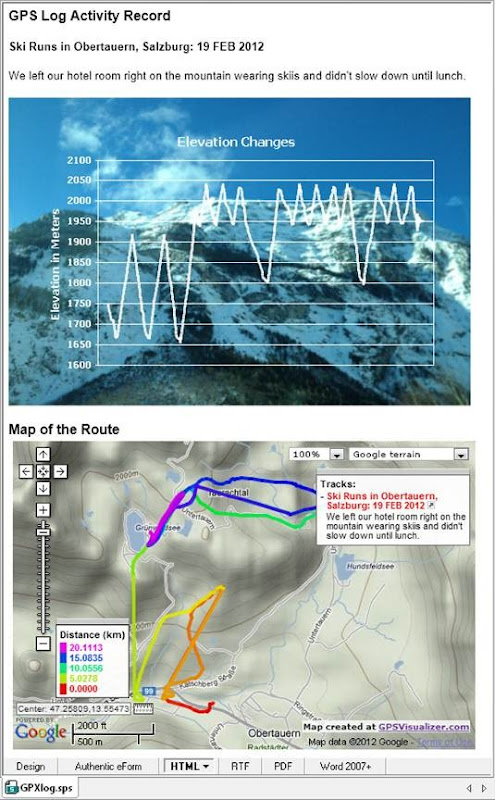
We carefully chose file names for the three files used in the stylesheet to describe their purpose instead of their contents. To create a new report, we can simply replace chartBackground.jpg, (the background photo for the chart), Log file.gpx (the working XML file), and routeMap.PNG (the map from GPS Visualizer) in the working files folder with copies corresponding to a different trip, then generate new output. We don’t need to make any changes or revisions to the SPS file! Simply swapping all three files and generating new HTML gave us this result for a ski trip in the Alps, not far from the Altova office in Vienna:
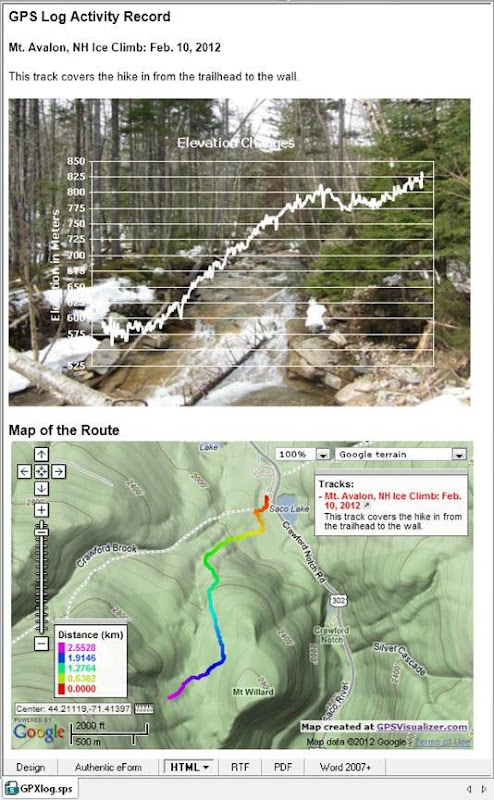
Swapping again created this result for a winter hike in the New Hampshire woods to reach an ice-climbing wall:
The same stylesheet can generate other formats too. Our design fits neatly as a one-page Microsoft Word document we can print and store in a binder.
If you’d like to produce reports based on your own GPS XML files, or if you need to accomplish any other reporting, e-forms, or multi-channel publishing requirement, click here to download a StyleVision free trial. StyleVision includes extensive online Help, including a tutorial and sample files. Altova even offers self-paced Beginner and Intermediate Online Training for StyleVision.
Editor’s Note: A follow-up to this post titled XPath Enhances XML Reports describes how to use XPath expressions to localize and add more data to reports on GPX data.
